
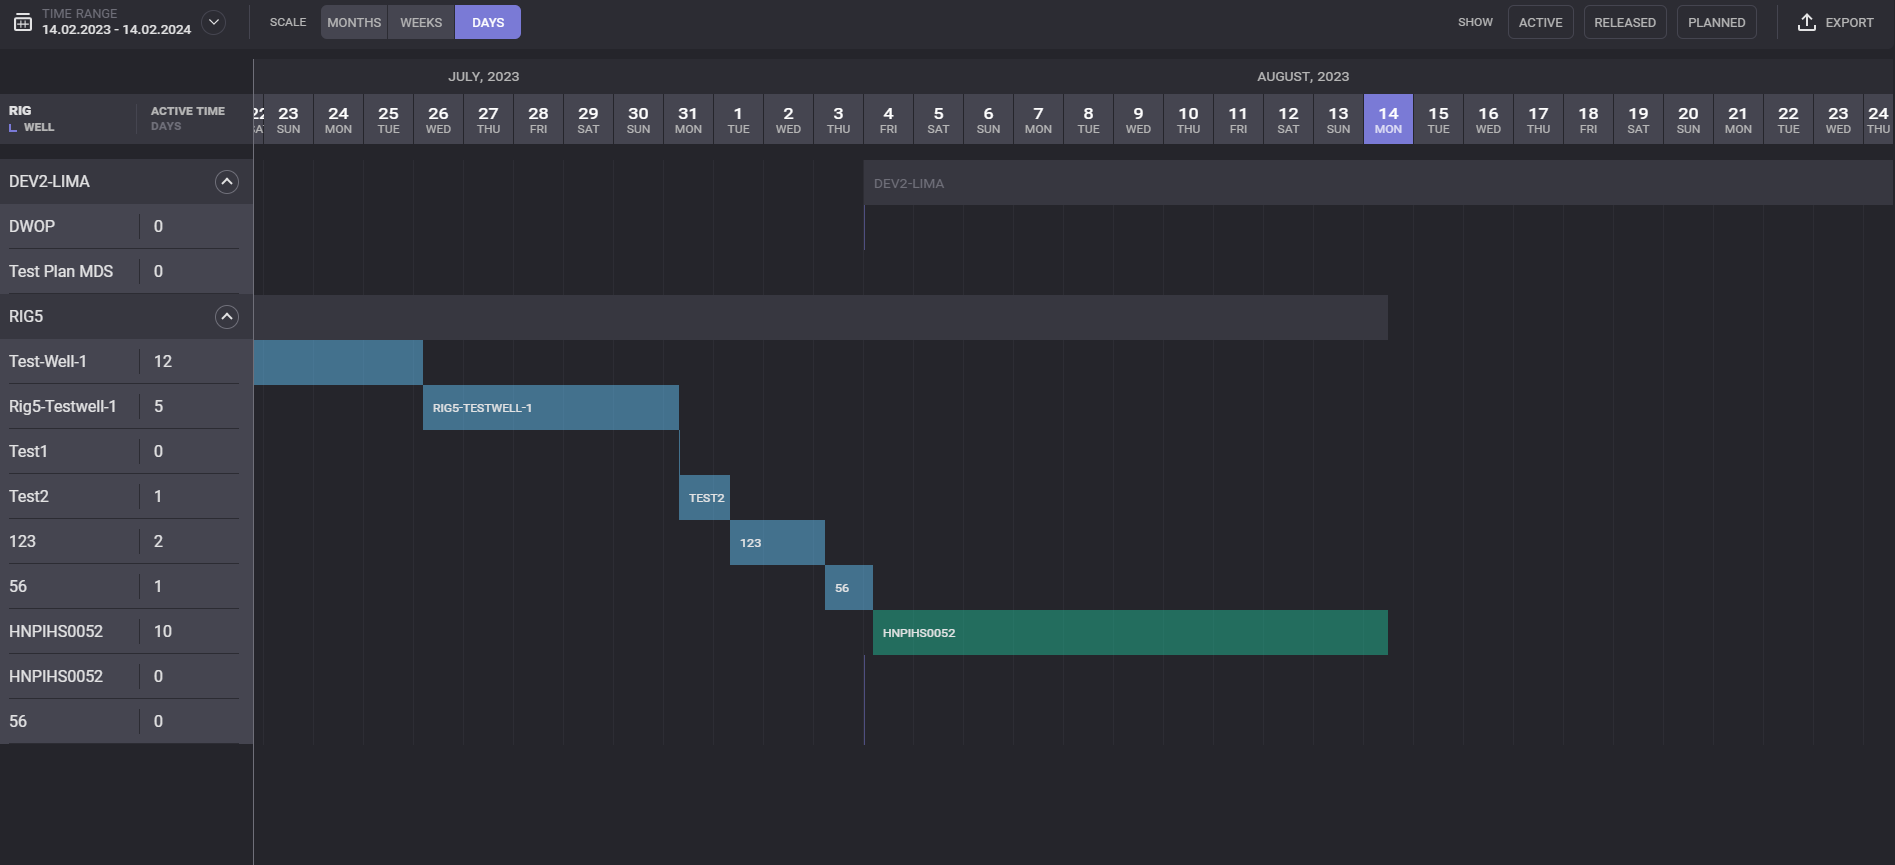
Gantt Chart
The Gantt chart, also known as the Gantt diagram, is a project management tool used to plan and schedule tasks over time.
Cyberloop provides this chart to offer users a powerful management tool where they can oversee the times at which wells were initiated and completed. Our chart enables the categorization of displayed wells based on whether they are active wells, released wells, or planned wells.
This section allow the user to scale the chart for being analyzed in different scales; Monthly, weekly or daily. As well as show the wells based on their status; Active, Released or Planned.
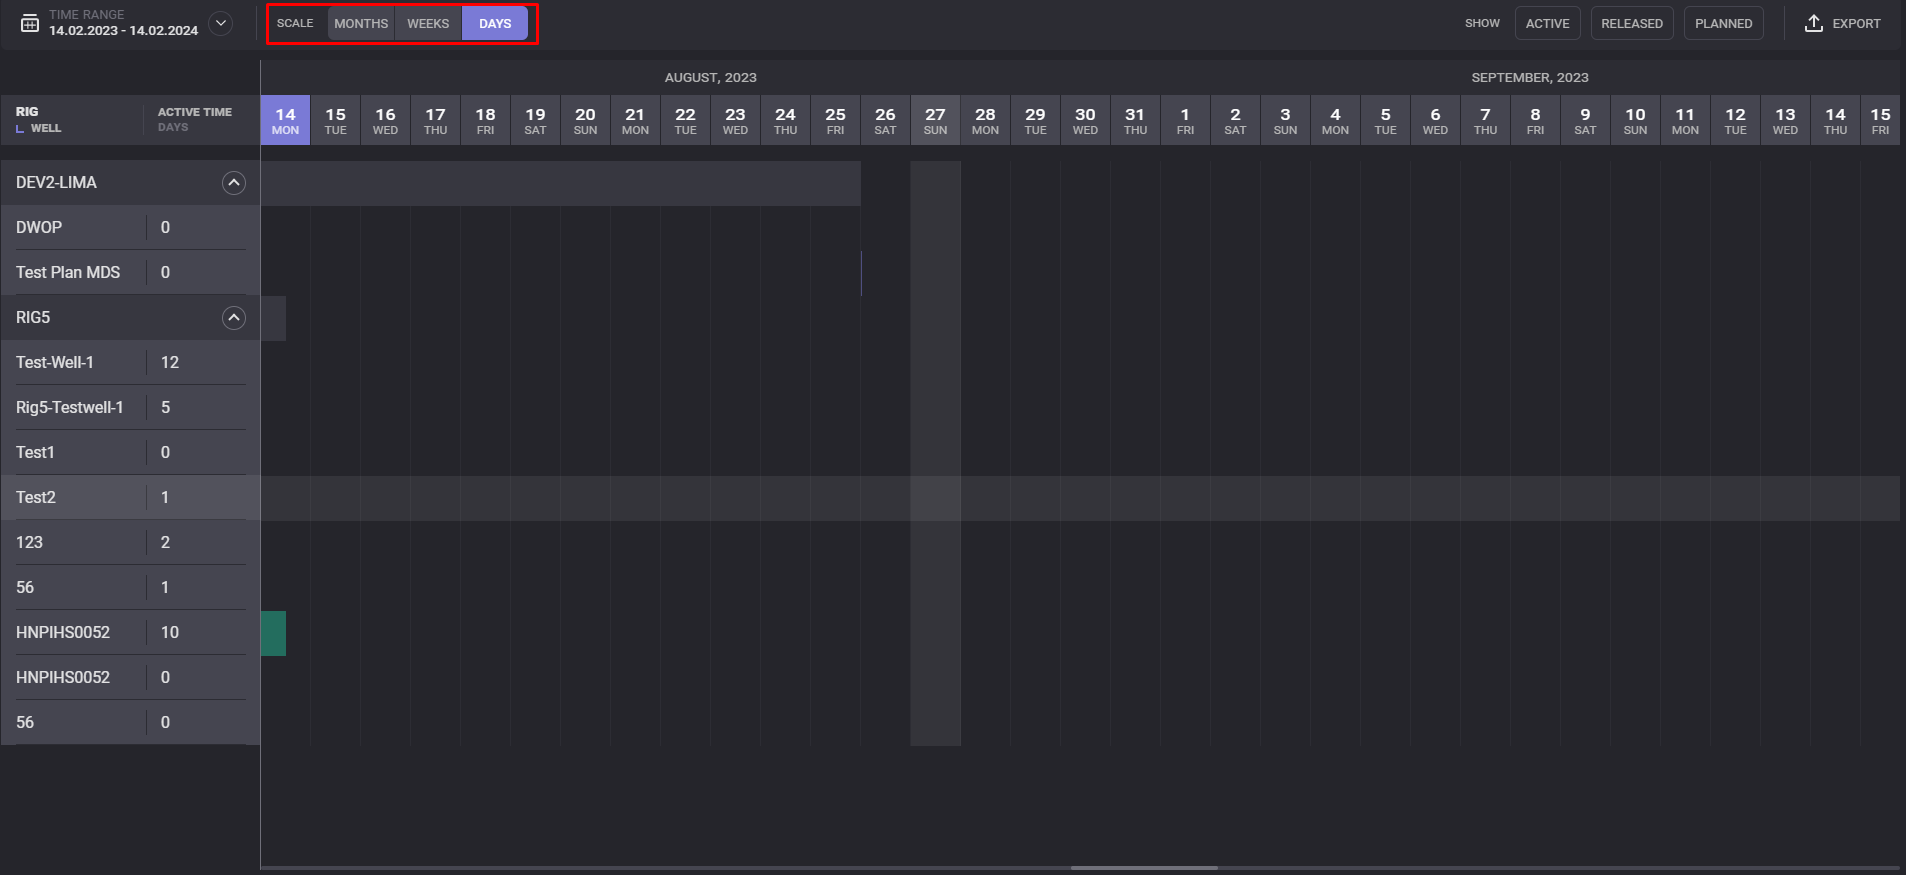
Scales
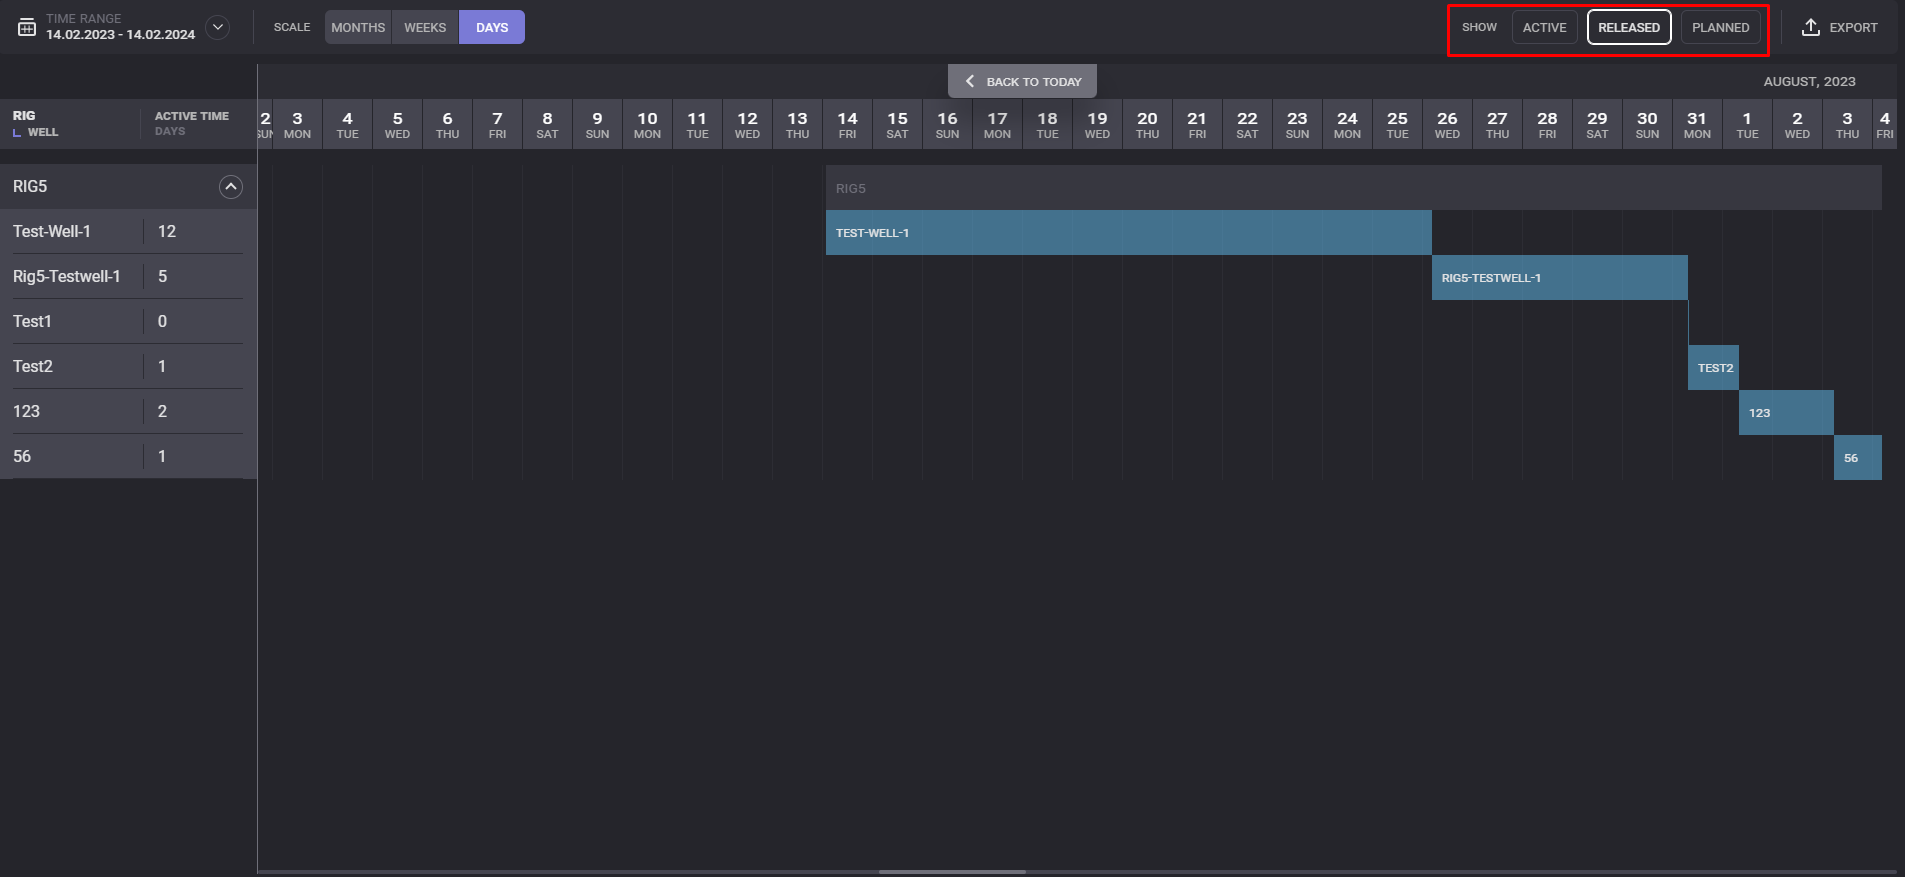
Well Status
By Clicking in Time Range button at the left up corner, user can select the desired time range to go straight for that period of time.
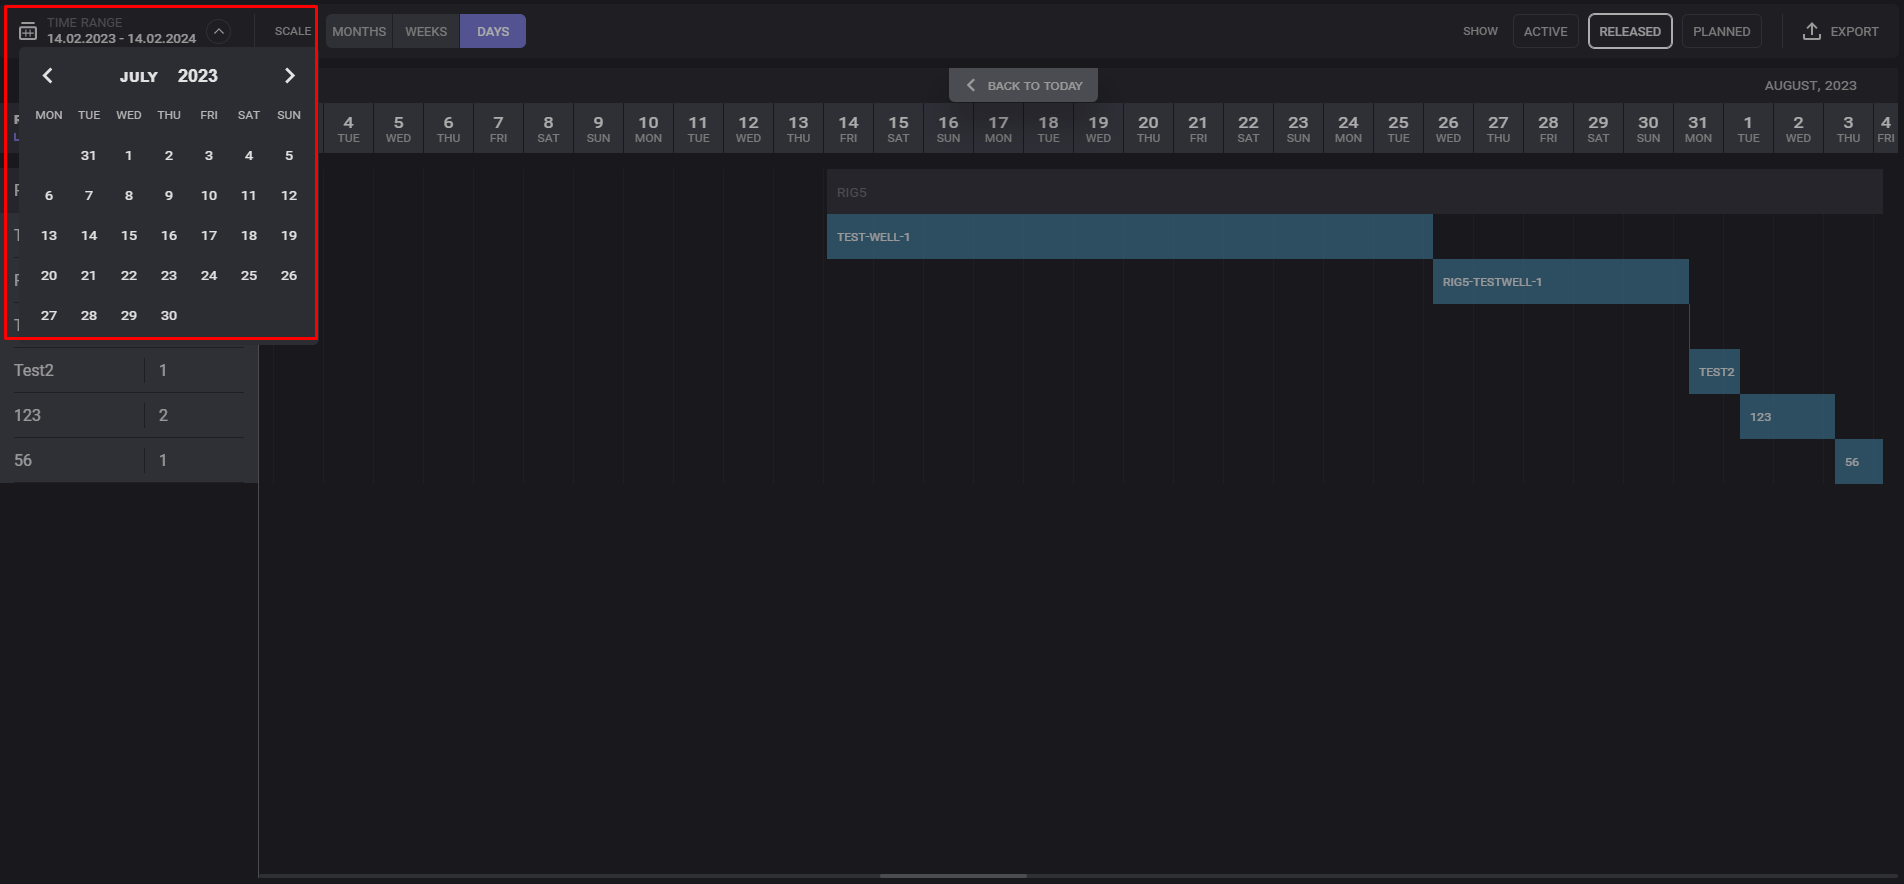
Time Range