
Portal Drilling
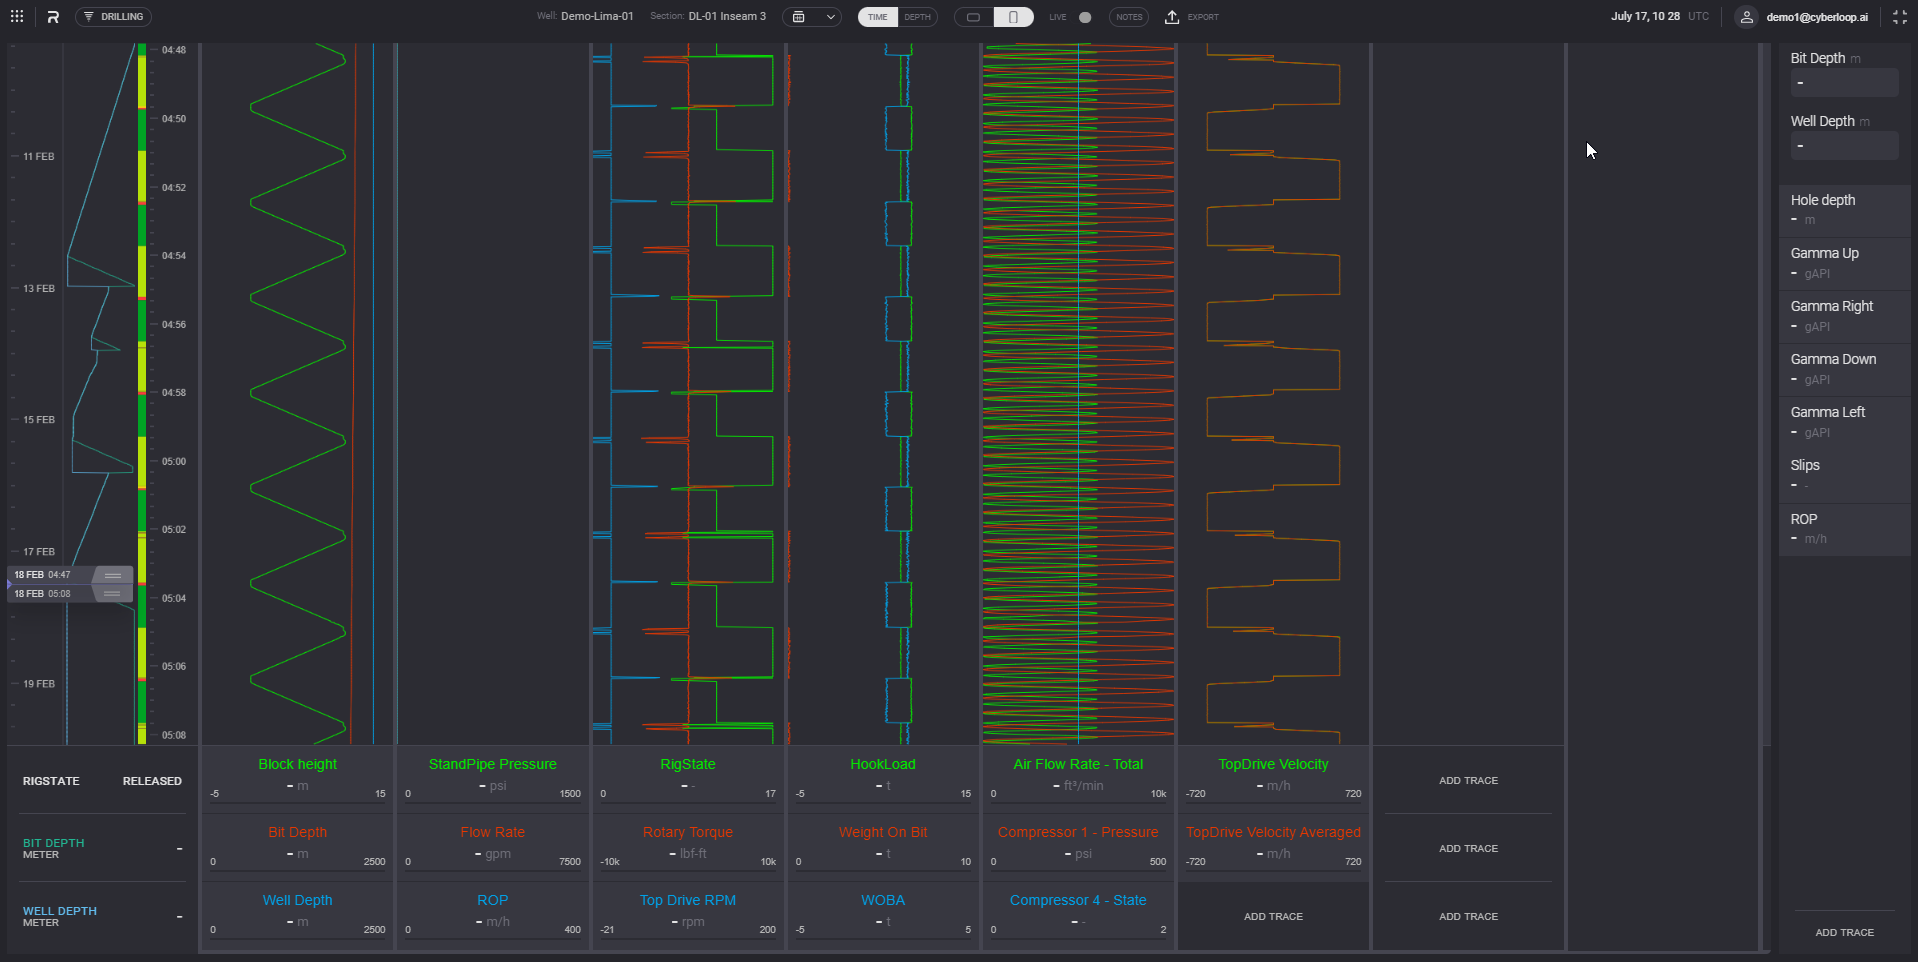
Click on the Well in the Wells table opens Drilling tab of the selected well. The Drilling tab shows realtime and historical EDR data. Selected parameters can be plotted on the charts. To add parameters to track on the charts click on the Add trace button at the bottom of the chart area. On one chart can be added three parameters. RIG state with Hole and Bit depth are plotted on the left chart by default.

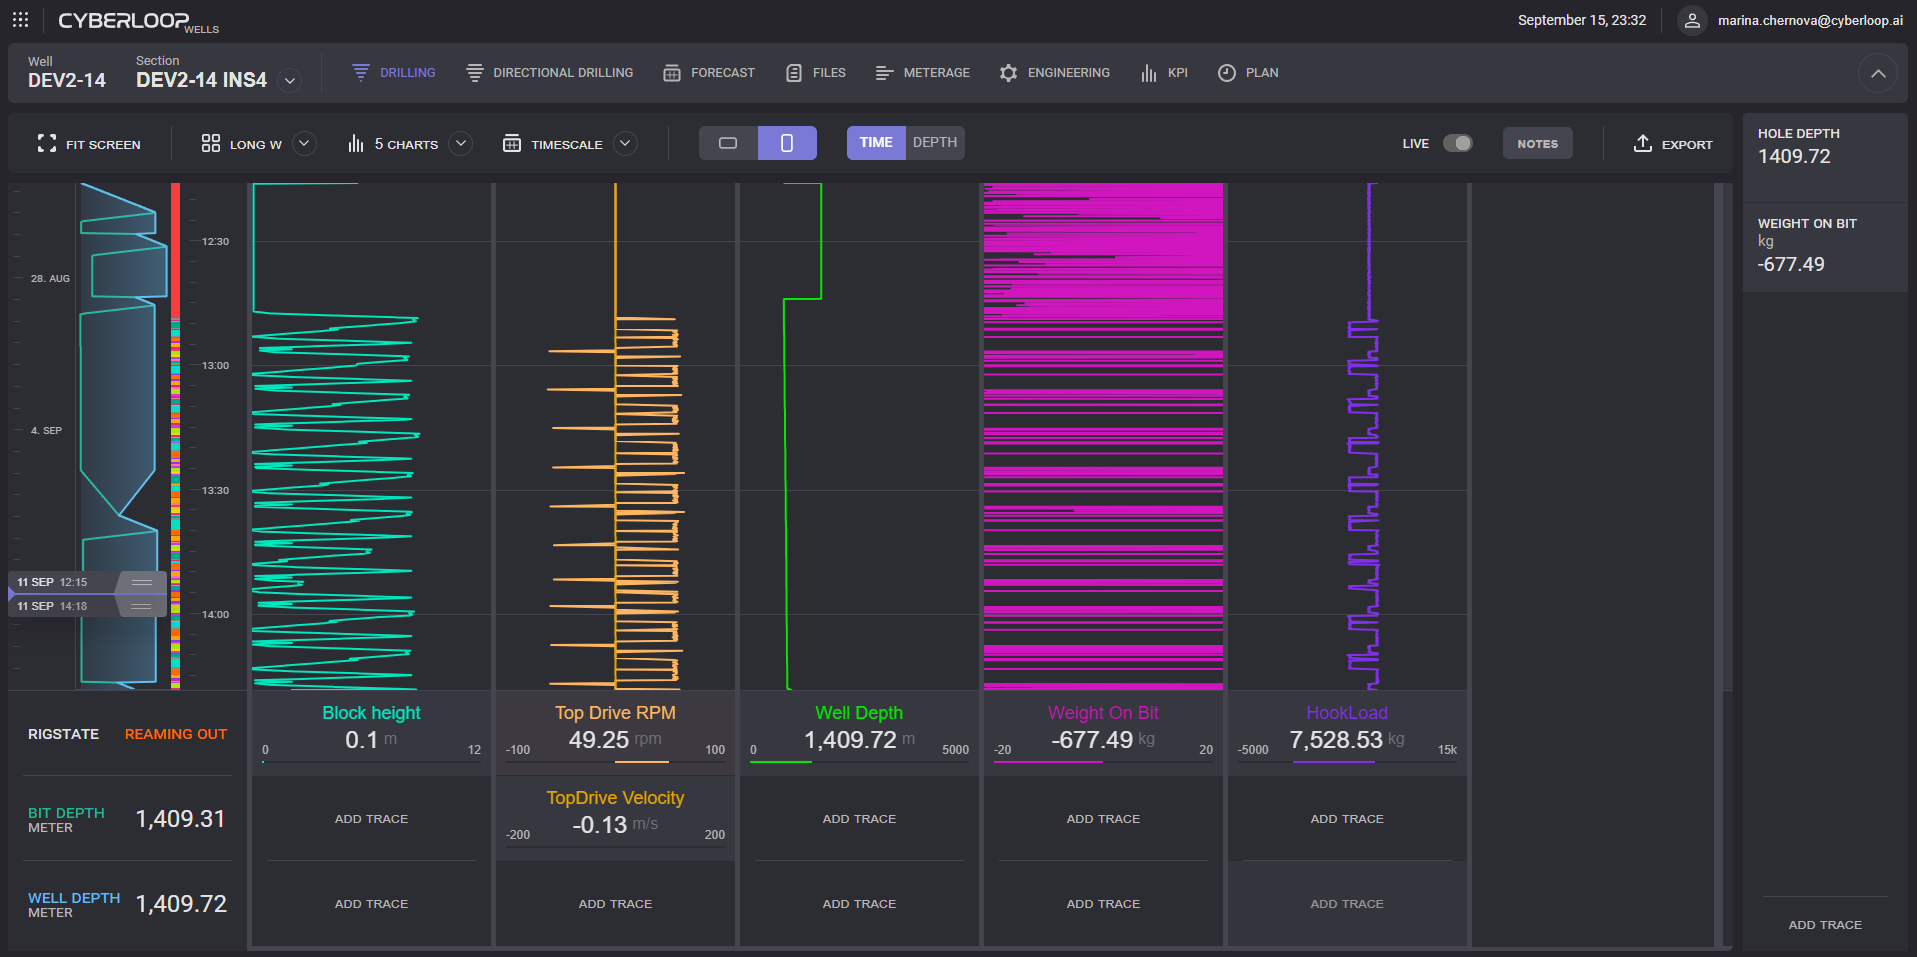
Directional drilling page can be viewed in the full screen mode. To turn the full screen mode on, click on the button on the top panel next to username ![]() . Top panels will be minimized and charts area expanded to the whole browser window.
. Top panels will be minimized and charts area expanded to the whole browser window.
To exit full screen mode, click on the button next to username.
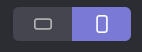
To scale the chart Zoom control on the top panel can be used. The view of the charts can be changed from vertical to horizontal on the top panel.
See the following video as example:
Chart Orientation Tutorial
Click on the point on the chart display dialog with exact value of the parameters at selected moment of time.
The drilling parameters can be monitored in Depth mode or Time mode. If the Depth mode is selected the charts are plotted depending on the hole depth. If the Time mode is selected the charts are plotted depending on the time. To switch to one of the two modes click on the corresponding button on the top panel.
The representation of the charts gets updated in real-time if the Live mode is turned on. Live mode can be turned on/turned off by toggle on the top panel.

The Far-Right column can fit additional data cards without plotting on charts. Click on Add trace option in the bottom right corner opens Add dialog. Click on the select trace field expands a drop-down list with available options. When parameter selected, units to be displayed can be specified. Selected units will be used on the added card on the panel.

To remove trace from the panel click on the “x“ icon in the corner of the card.
Chart Navigation
To zoom in some region on the chart, click and hold the left button of the mouse and select the necessary area on the chart. The selected area will be plotted on the chart on releasing pressed left mouse button. Corresponding time/depth range will be selected on the state chart.
Using the mouse wheel, time/depth range can be scrolled up or down, and as result, the charts got re-plotted.
Timescale and Depthscale
Depending on current mode Timescale or Depthscale selectors available on the top action panel.


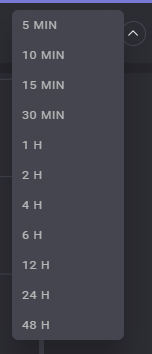
Click on the option expands the drop-down list with available ranges. Selected range will be applied to the charts.
The range can be defined on the Days/Depth dependency graph by dragging the Slider controls. Controls are set to the Well start date and time by default. Selected range colored with green on the RIGSTATE chart.
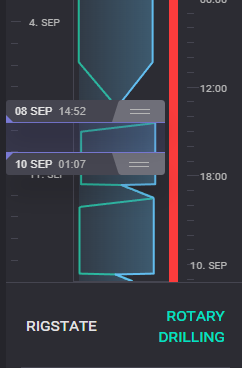
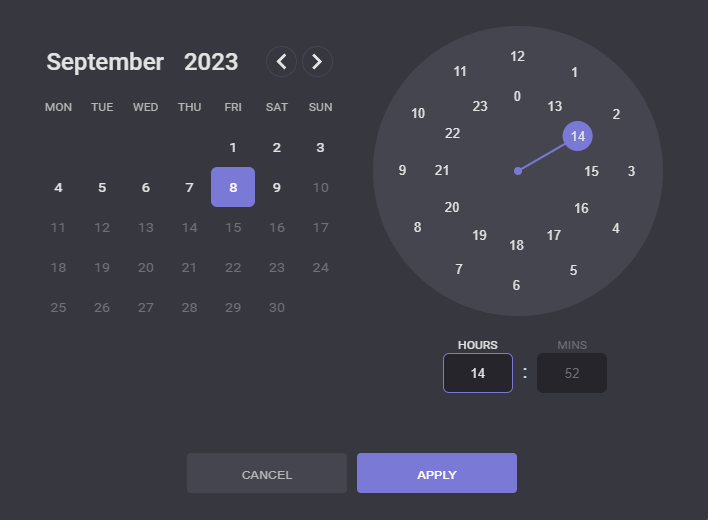
The dates for the range can be edited manually by clicking on the date on the slider of the range selector. Date and time picker will be expanded on click on it.
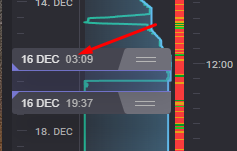
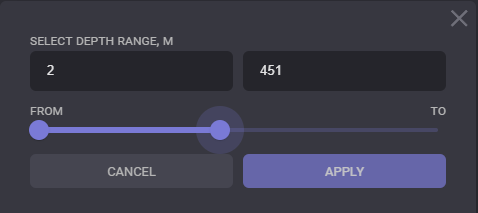
FROM and TO values can be edited manually by clicking on the value on the slider of the range selector on the chart. When the Depth mode, selected depth range can be selected. In the Depth range dialog, range can be defined manually or by dragging controls on the scale FROM - TO.
Live mode is turned off when a specific time or depth range is selected. When the Live mode is tuned on, the selected range will be reset to the live values.
After read these useful information above, please see the following video tutorial about how to navigate through the charts on different modes:
Chart Navigation Tutorial
Traces and Workspace
To add trace to the chart, click on the Add Trace button. Click on the Select trace field in the Add dialog expands drop-down list of available parameters that can be displayed on the chart. When parameter selected default units, minimum and maximum values and graph color got selected automatically.
Units to be used on the chart can be changed by selecting it from the drop-down list. Line weight on the chart can be defined by “+“ and “-“ controls or entered manually.
Min and Max values are define the range of values that will be used on the chart for current parameter.
To remove trace from the chart click on the “X“ icon in the top right corner of the trace legend. The icon will appear on hovering on the trace legend.
Workspaces allow saving a customized template of the chart's representation and to use it on other wells and sections. To switch from one workspace to another click on the My workspace option on the top panel.

In the opened dialog click on picked template and confirm selection. The template of the current workspace is highlighted in the list.
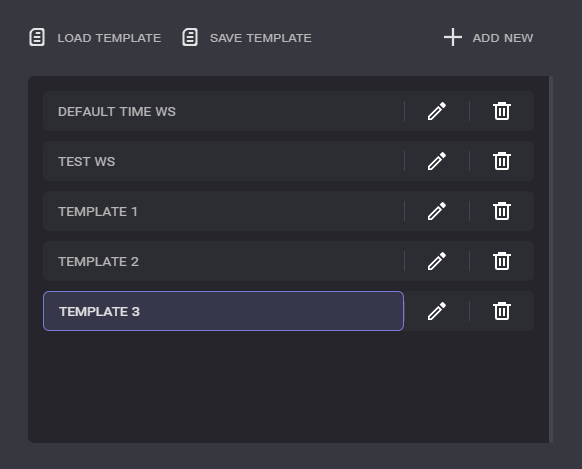
To create new Workspace click Add new button in the opened dialog. Enter workspace name and click on Create button. New workspace will be added to the list.
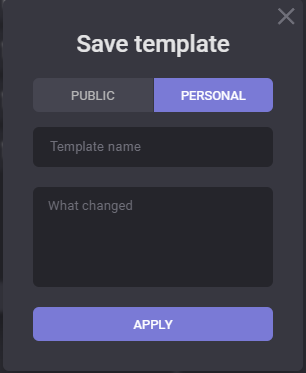
Created workspace templates can be used by other users or in other spaces after saving. Switch to template to be saved in the My workspace dialog and click on the Save template button. In the Save template dialog has to be selected the type: public or personal. After clicking on Apply the template will be added to the saved list.
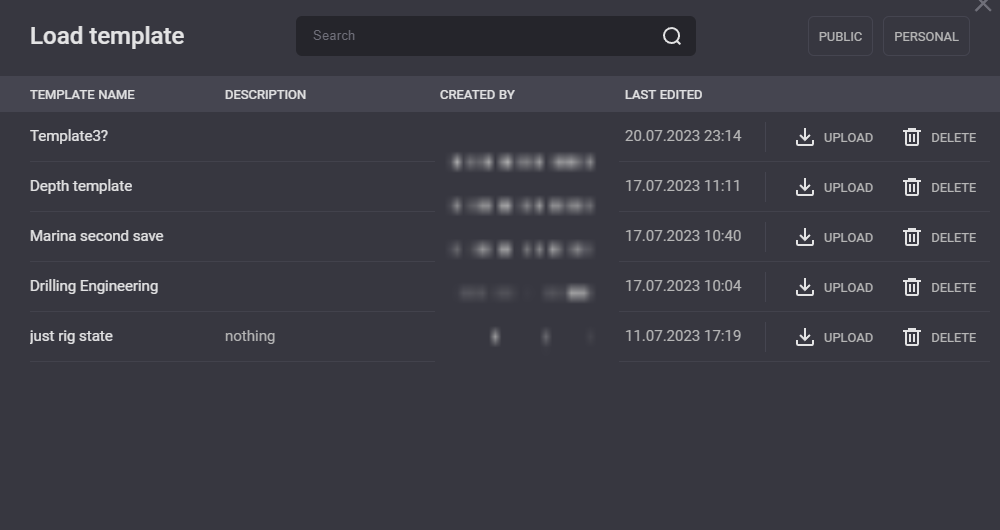
Saved templates can be added to the My workspace list by Load template option. Click on Upload next to the selected template will add it to the templates list. To filter the templates list by its type, use buttons in the top right corner of the dialog.
See the following Workspace video tutorial for further information:
Workspace
Alarms
In the Alarms block the values to trigger alarms can be set. To unlock alarms fields tick the “Use custom alarms option“. There are four values that can be specified:
LoLo - if the parameter is lower than this value its legend will be highlighted with red color on the chart;
Lo - if the parameter is lower than this value its legend will be highlighted with yellow color on the chart;
HiHi - if the parameter is higher than this value its legend will be highlighted with red color on the chart;
Hi - if the parameter is higher than this value its legend will be highlighted with yellow color on the chart.
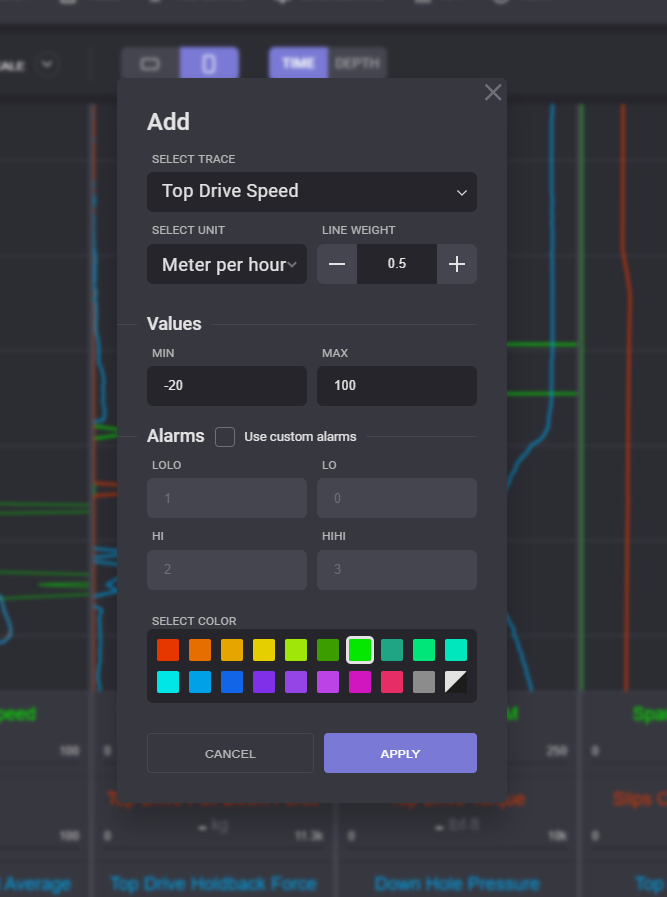
Colour of the graph is preselected and can be changed on the colour picker block. Black/White colour depends on current theme and corresponding colour will be used with changing theme.
Click on the Apply button will add new graph on the chart.
Graph parameters can be changed by clicking on its legend on the chart. In the Edit dialog trace and all its parameters can be changed.
Please see the following video tutorial about Alarms for further information:
Alarm video Tutorial
Notes
During the drilling process notes can be viewed and created by Portal user.
To expand or hide notes panel click on the Notes on the top panel. Created notes got attached to the selected moment of time or depth.
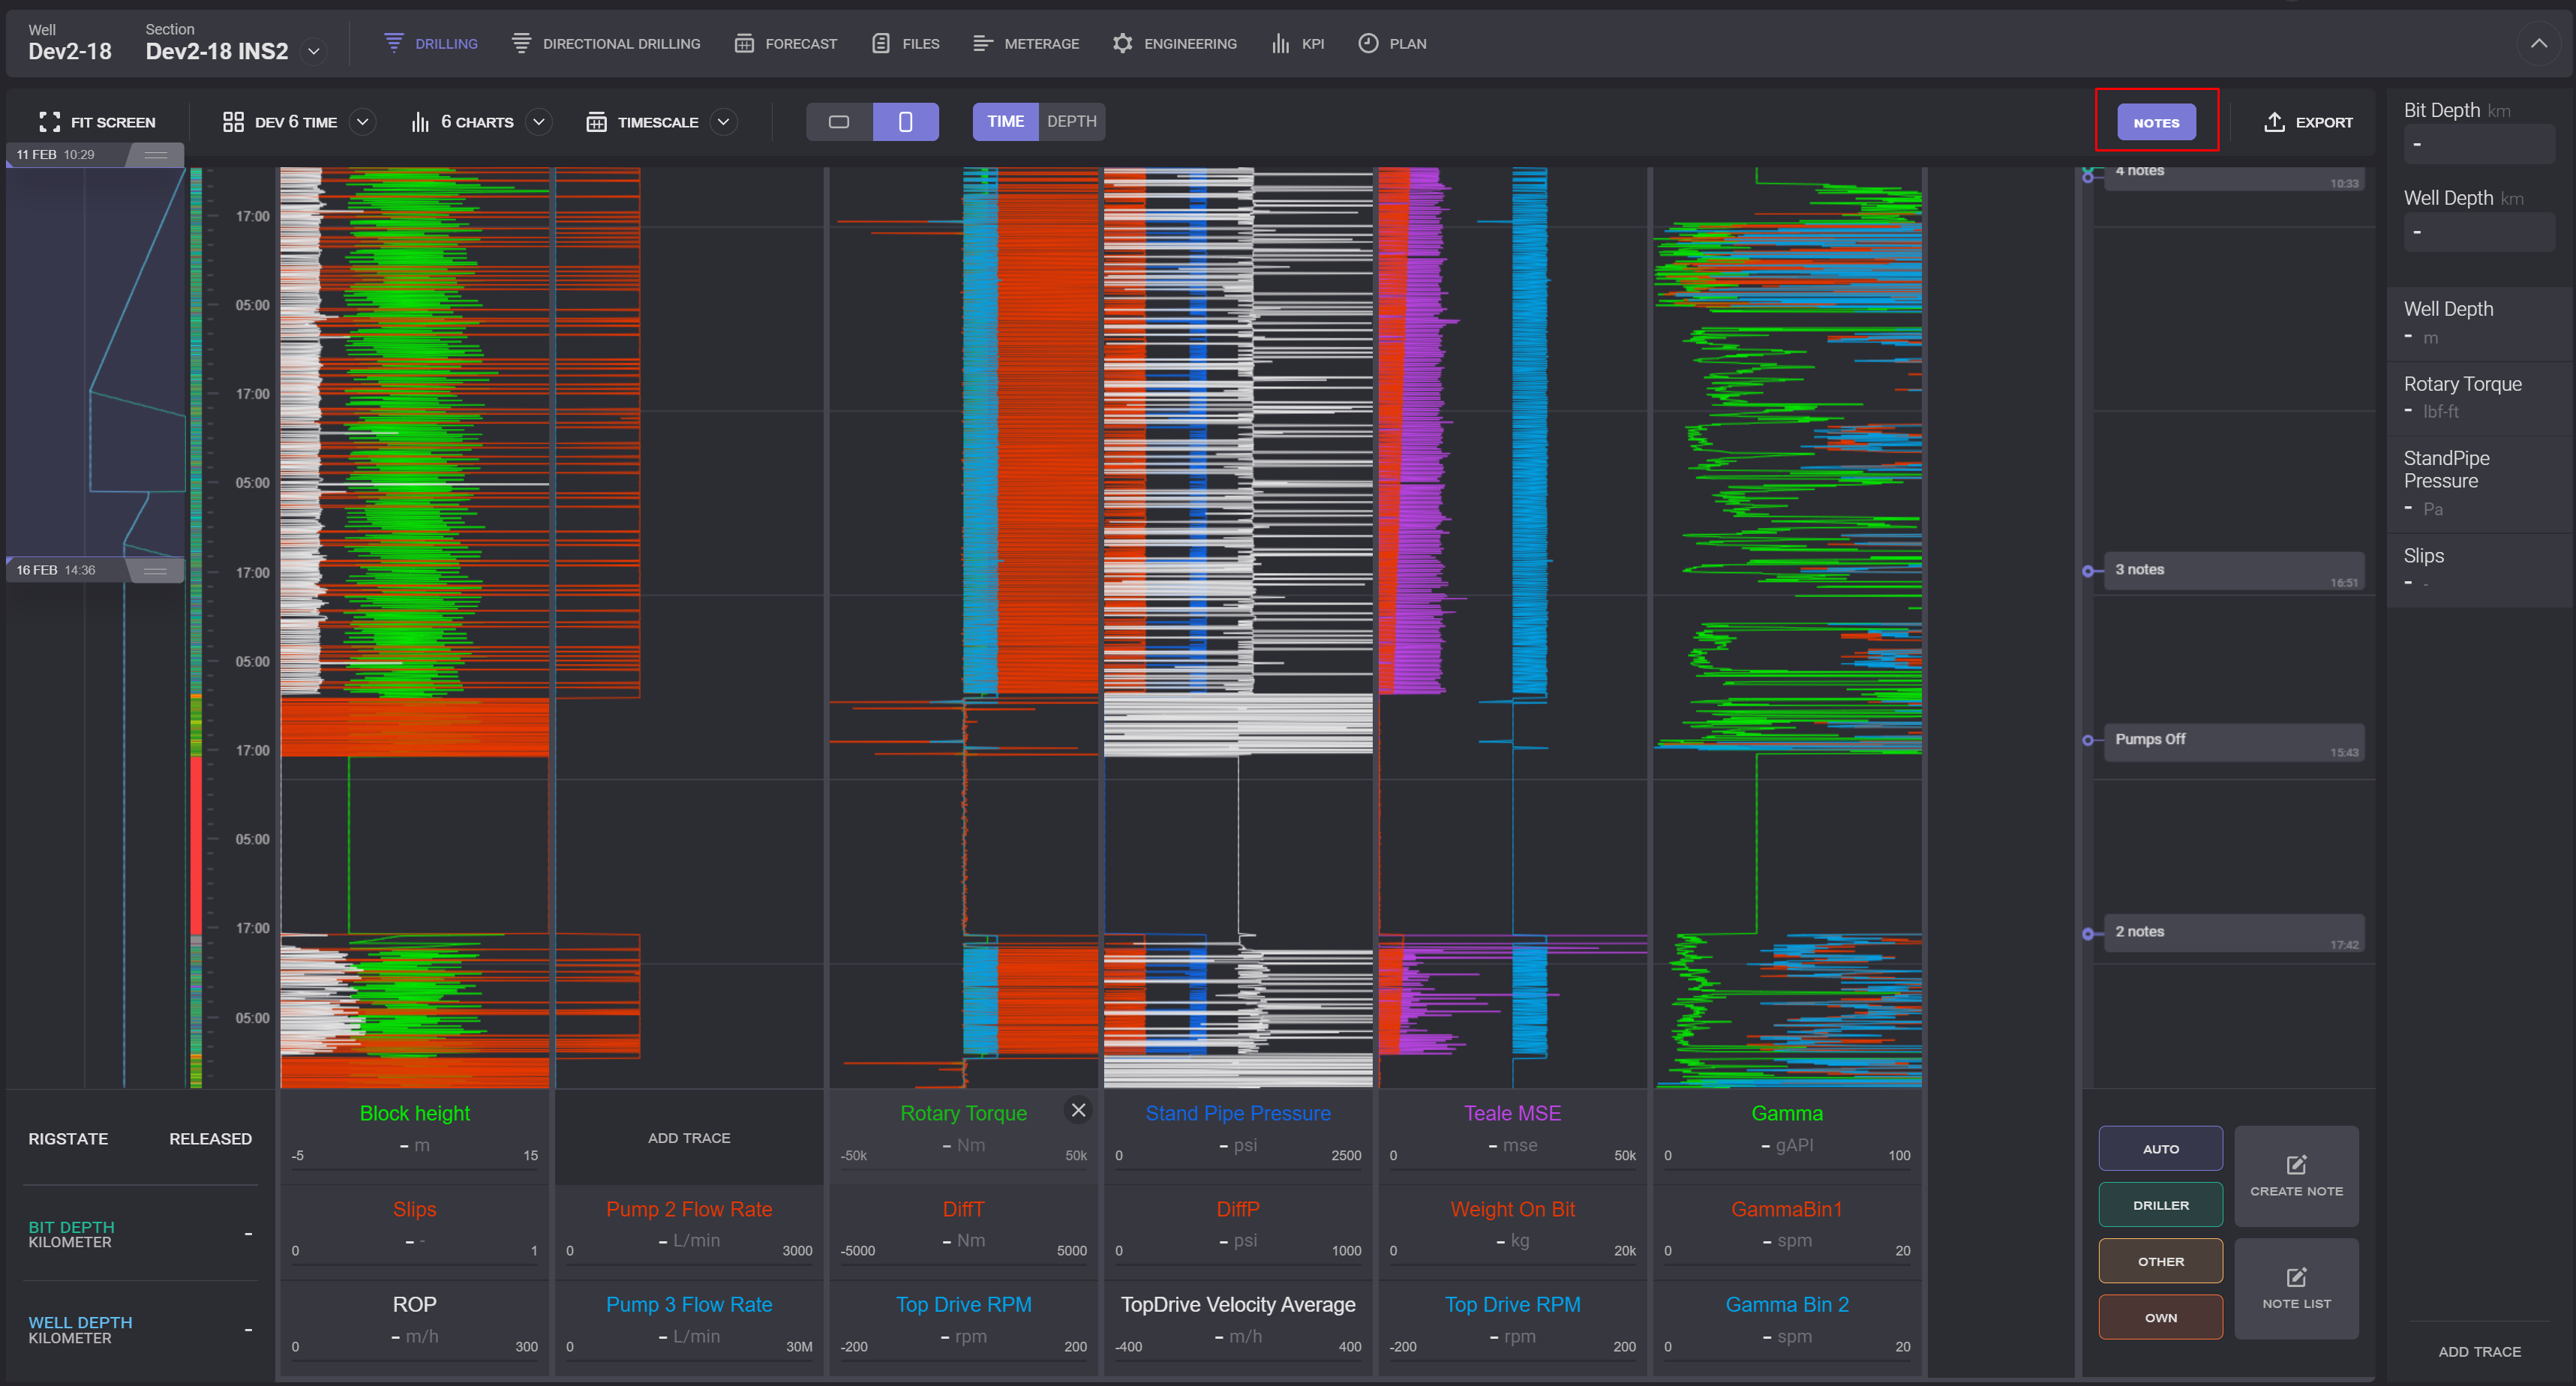
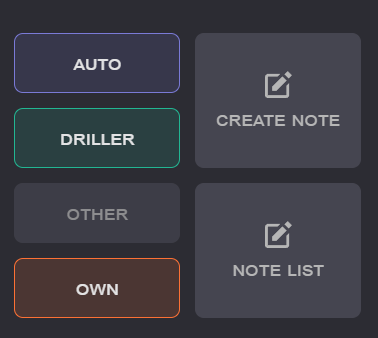
There are four types of notes that differs by creating: Auto (Automatically generated), Driller (created by driller from EDR), Other (public notes created by any other users) and Own (created by current user). To display or hide a type of notes click on the option in the bottom of the panel.
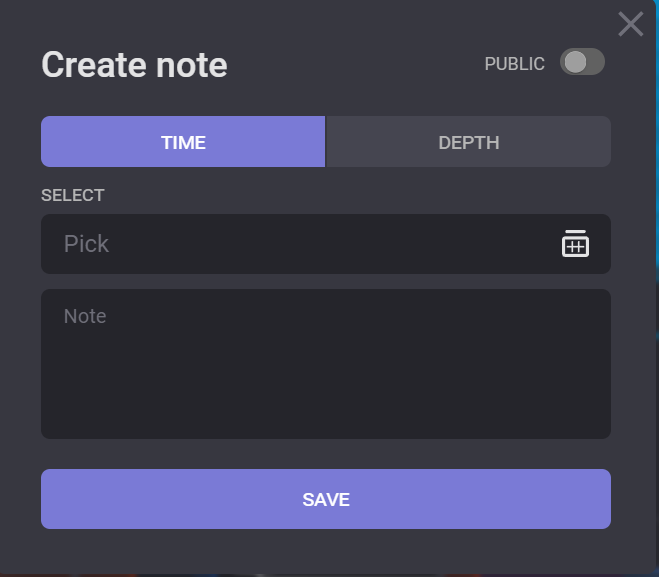
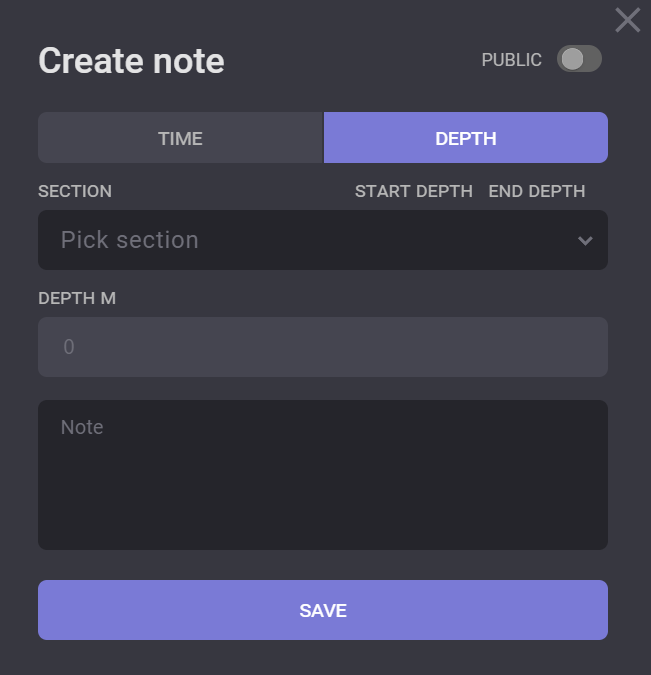
Create Note
New note can be created by Create Note option. New note can be created as public or private. Public note will be visible to other users of the application. Private notes are visible only to user - creator. To create public note turn Public toggle on ![]() in the Create Note dialogue.
in the Create Note dialogue.
In the Create note dialogue you can select the mode (Time or Depth) where the note will be assigned. Depending on selected mode the time or depth for the note can be defined.
 |  |
|---|
Time mode notes
For the Time mode note the date and time should be selected on the date/time picker. For the active well the current date and time will be preselected by default. The note cannot be created earlier than the well start. If the well is released, then the time range will be limited by release date and time.
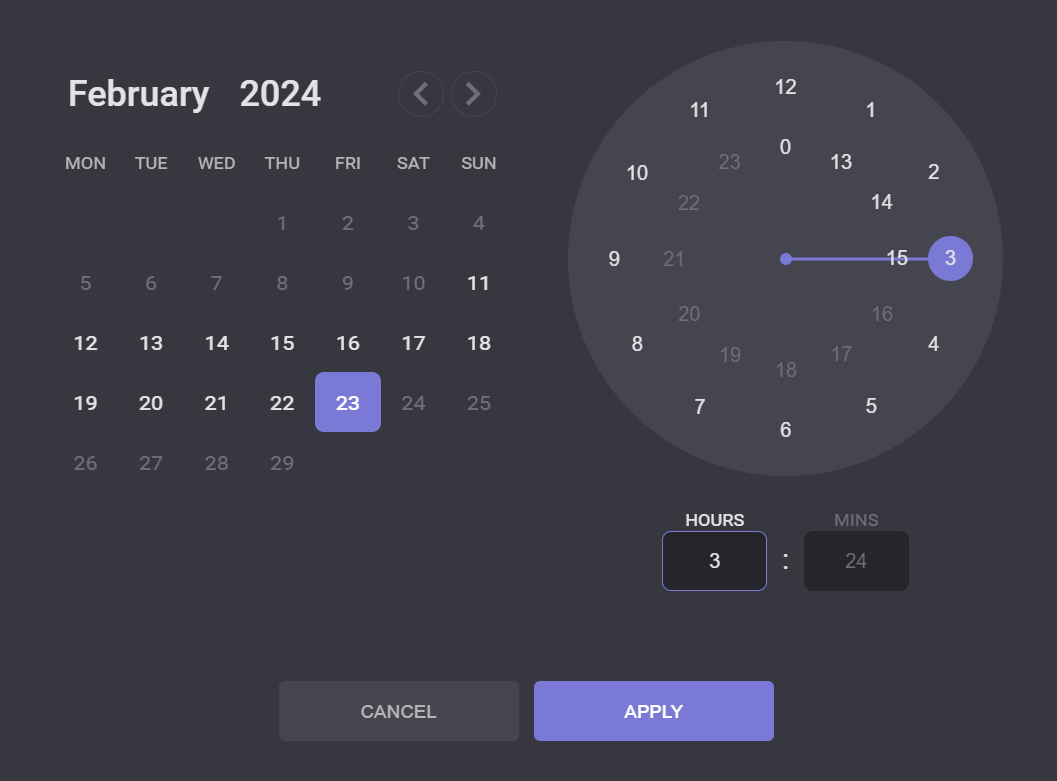
Create note will be displayed on the Notes panel if the drilling time mode is selected.
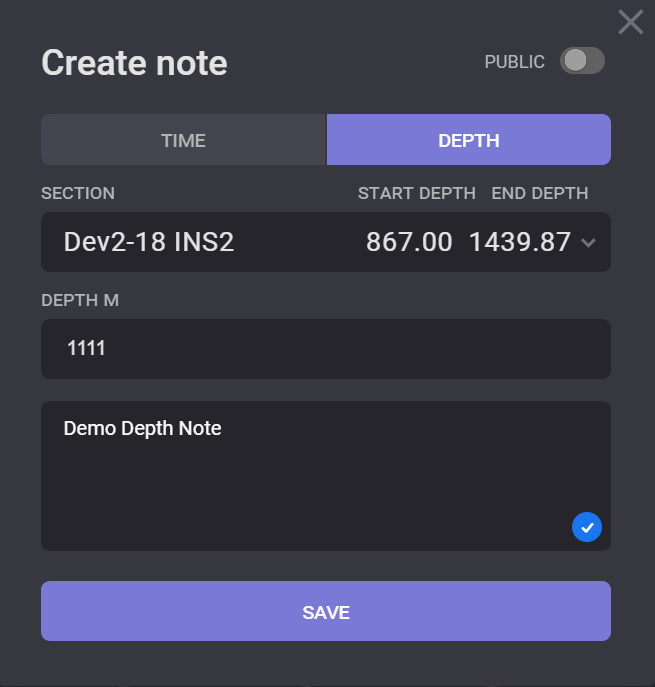
Depth mode notes
Depth note is associated with the some well depth. For this type of note Section and depth should be defined. Note cannot be created without section. Associated depth cannot be outside the section depth range.
Notes list
To view a list with all notes click on the Note List option on the Notes panel. All notes for current well will be displayed in the opened modal window. The list of notes got filtered by the type (public/personal) and by the mode (time/depth).
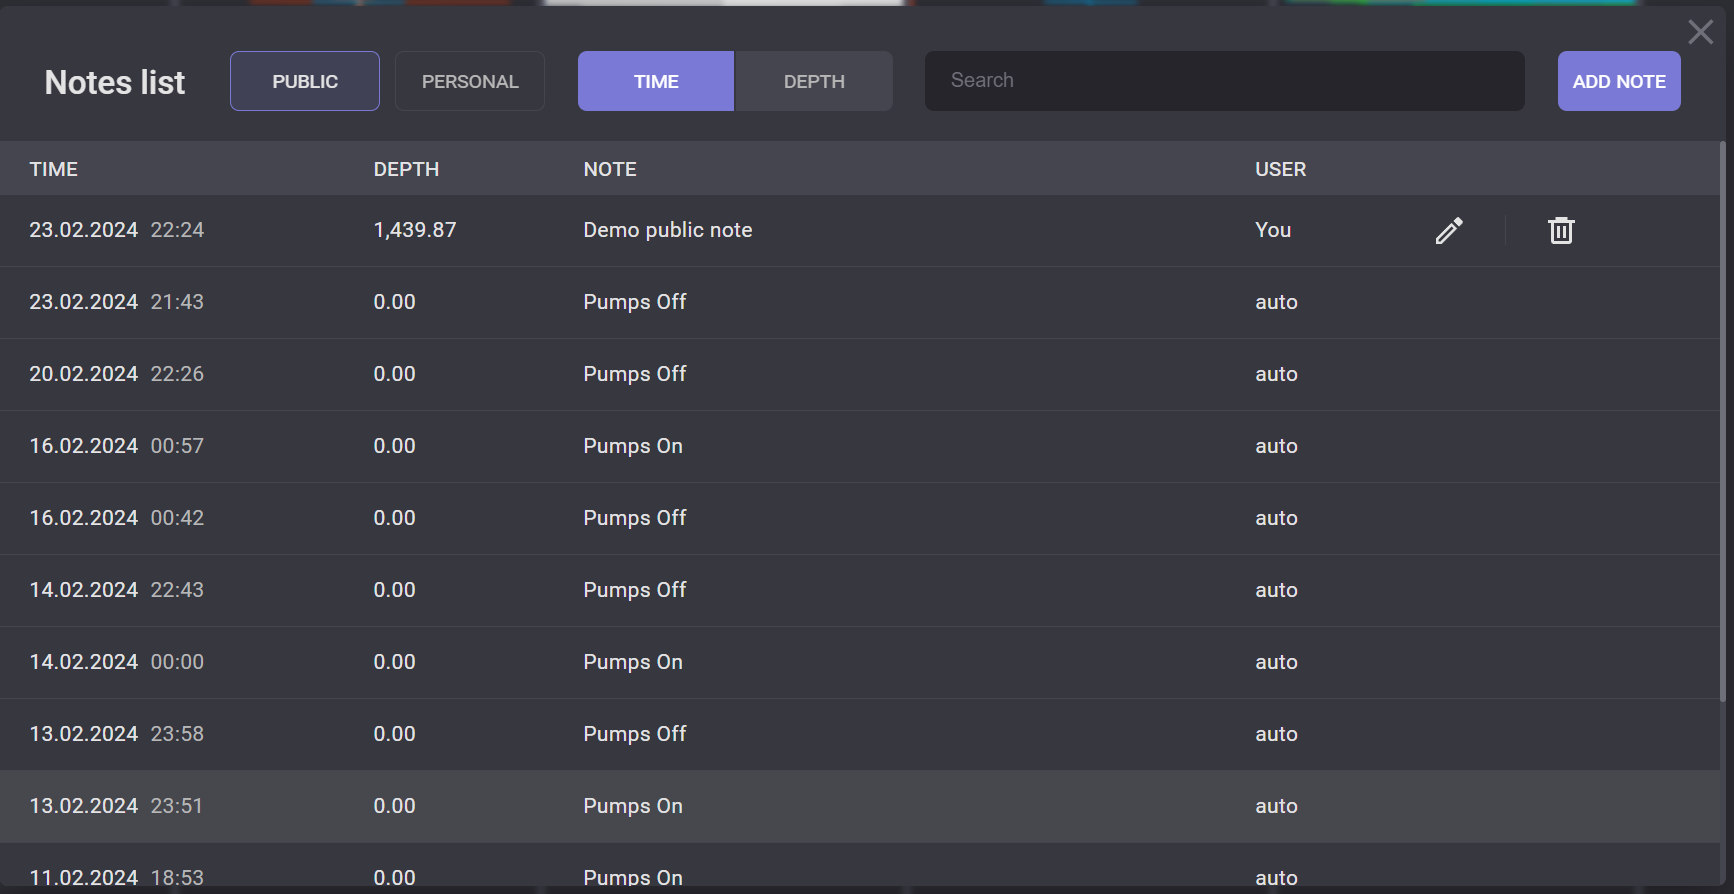
Personal and public notes created by current user can be edited by clicking on pencil icon ![]() next to it. In the opened Edit note dialogue the text of the note and associated date and time/section and depth can be changed. Changes of the note will be applied on click on the Save button.
next to it. In the opened Edit note dialogue the text of the note and associated date and time/section and depth can be changed. Changes of the note will be applied on click on the Save button.
To remove personal note, or public note created by current user click on the bucket icon ![]() next to it.
next to it.
Number of charts

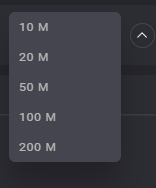
Number of charts can be changed for current workspace. Click on the Charts option on the top panel expands a drop-down list with charts numbers. The selected number in the drop-down list applied immediately to the workspace. The maximum number of charts for one workspace is 10 and the minimum is 1. When selected number is bigger than current number of charts, empty charts got added after existing ones. Previously added traces will be saved on existed charts.
If the selected number of charts in the drop-down list is smaller than the current number of charts, the charts areas will be removed from the end or from the top. The traces on the charts got saved when it got hidden from the workspace.
Export
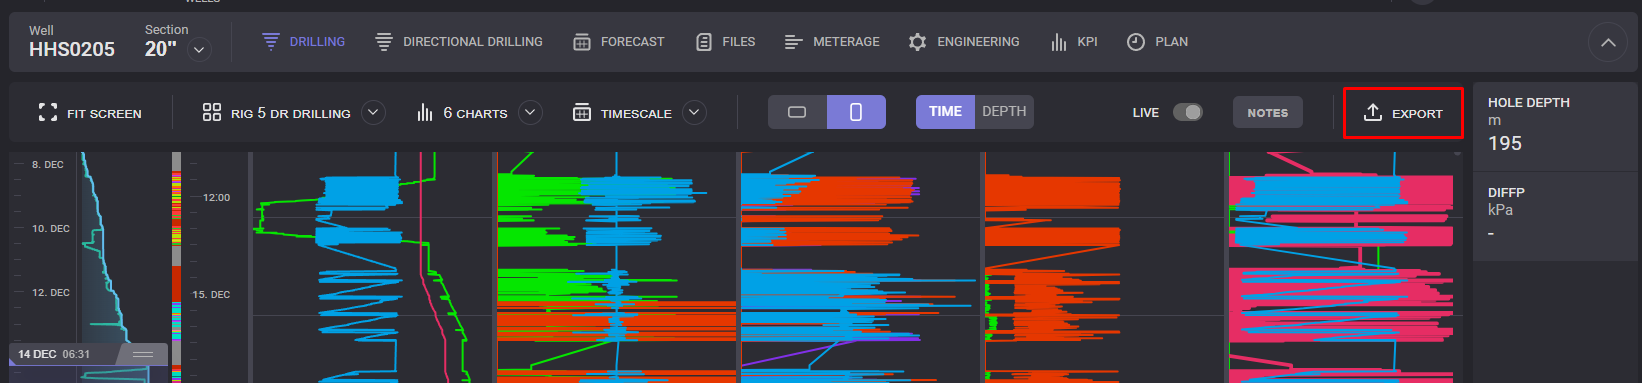
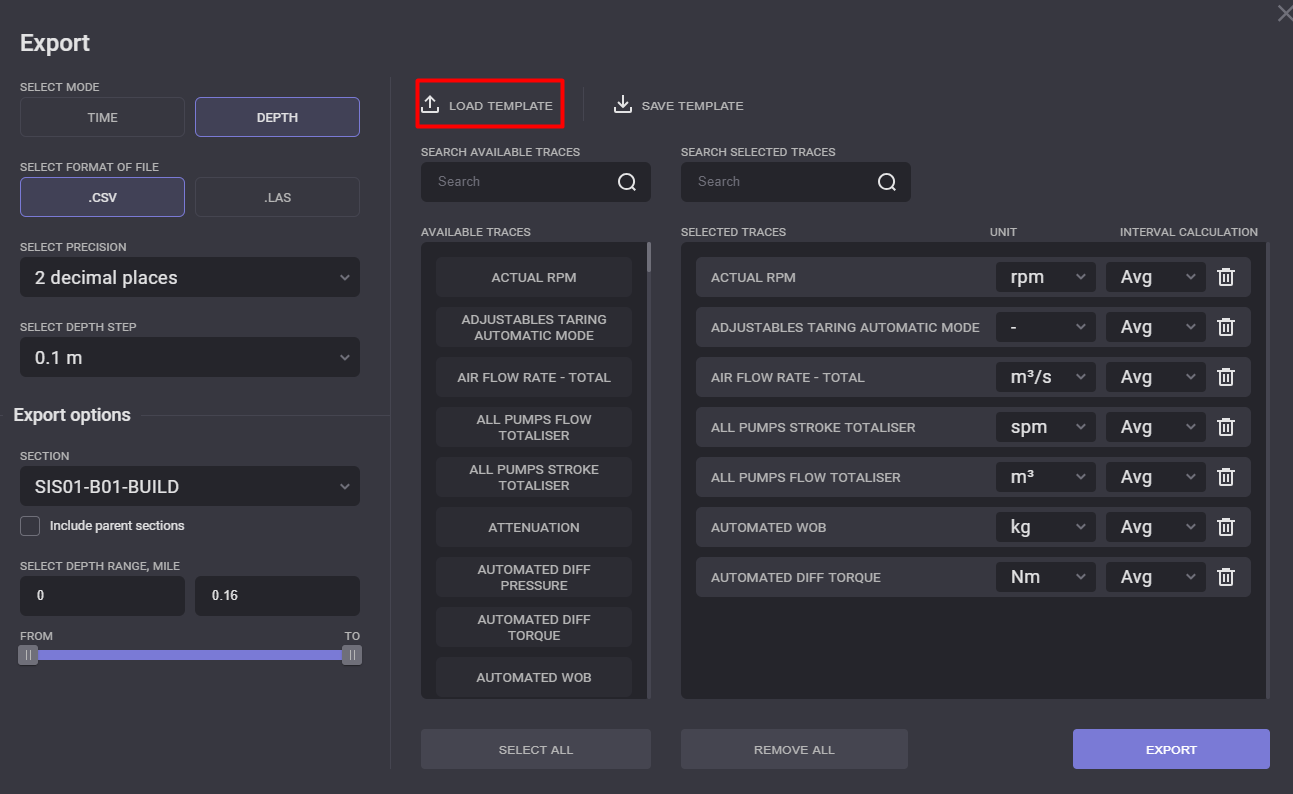
Parameters can be exported to the report. Click on Export opens dialog with export parameters. The report can be exported in two formats: .csv and .las.
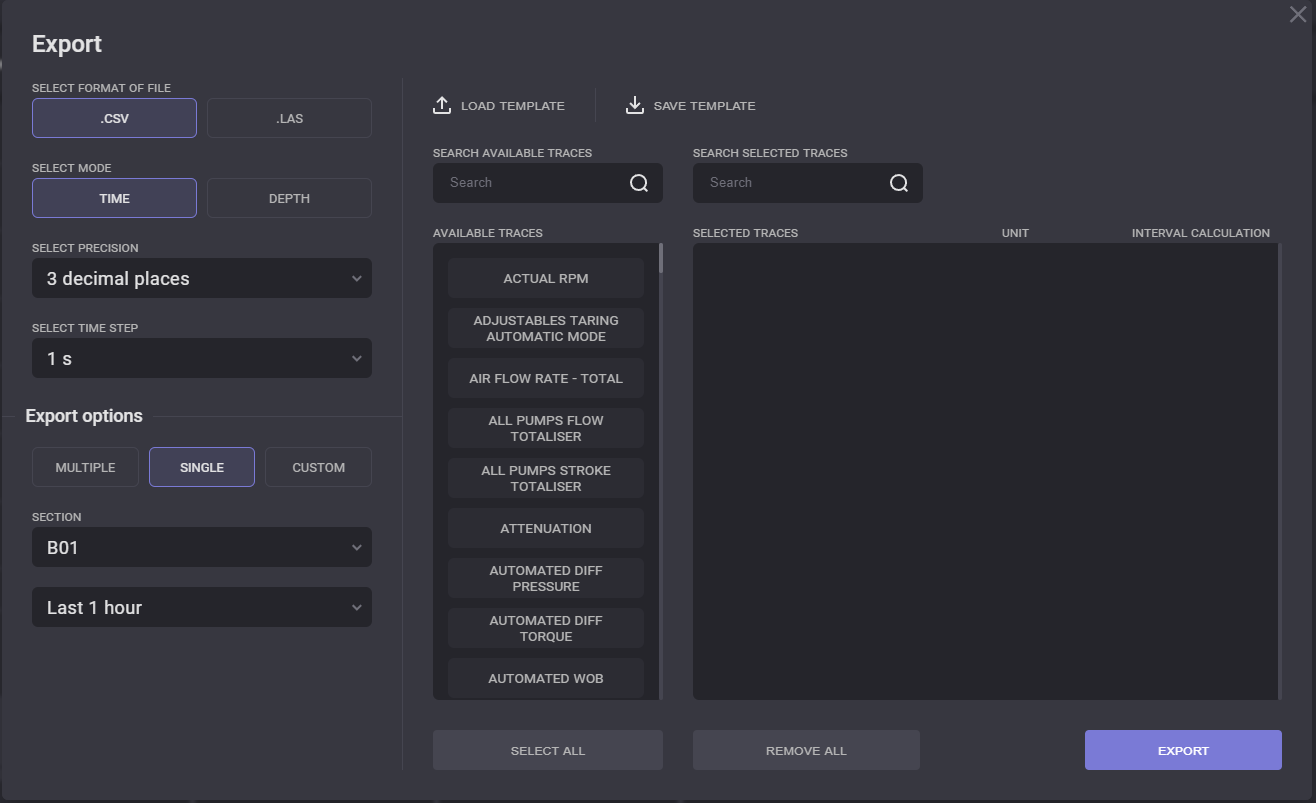
Precision for the exported values can be set from 1 to 5 decimal places, and time or depth step can be selected from the drop-down list.
Depending on selected mode, export options for the report should be specified.
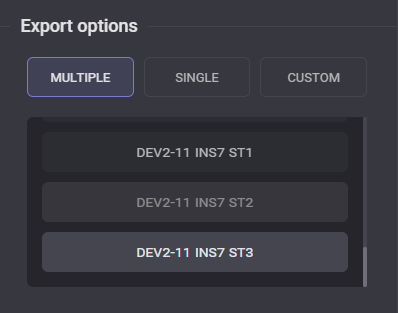
Time mode export
For the Time mode to the report can be included parameters for one section, for several sections of the well or the time range for the report can be defined manually on the range picker. If Multiple option is picked, numerous sections can be selected to be included in the report. Section got selected by mouse click on it and got highlighted with gray color. Second click deselects section. Current or last section got selected by default.
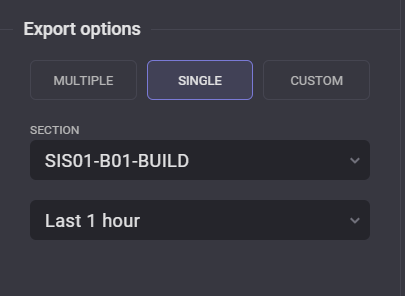
When Single option is selected, the only section to be included in the report can be picked in the drop-down list. The time range for the report can be changed by selecting it from the drop-down list.
Custom option allow setting time range for export manually.
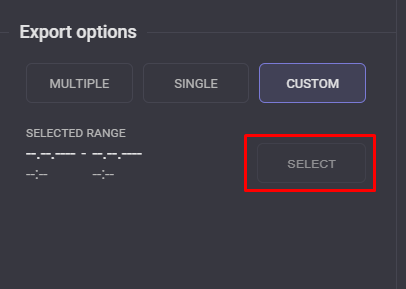
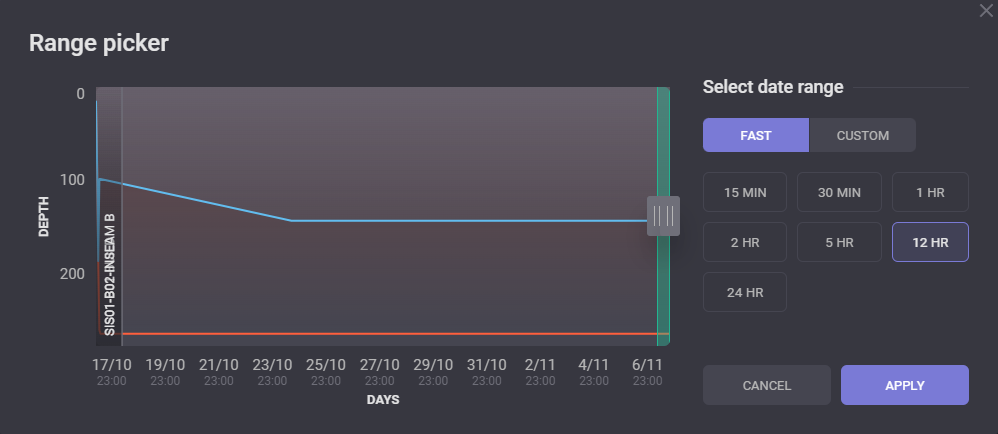
Click on Select button opens range picker dialog. In the Time range picker dialog can be selected a period that will be included to the report. The range can be defined on the Days/Depth dependency graph by dragging the Slider controls or entered manually.
Controls are set to the Well start date and time by default. Range colored with green will be applied to the charts after clicking on the Apply button. Already selected time range can be changed by clicking on Change button.
There are two options to select date range manually: Fast and Custom. Fast selector allow to select one of the predefined ranges. Click on the range will be displayed on the Days/Depth chart. The end of the fast range is always end of the drilling range.
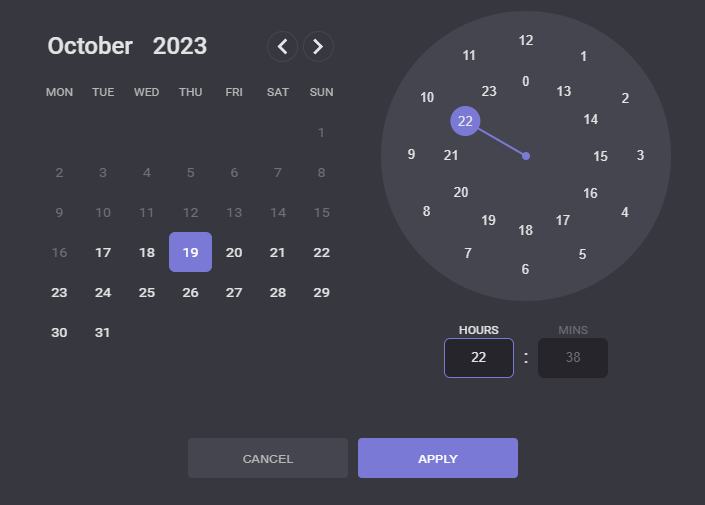
If the Custom date range selected FROM and TO values can be entered manually or selected on the date-time picker. Date-time picker dialogue got expanded by click on the calendar icon next to FROM or TO values.
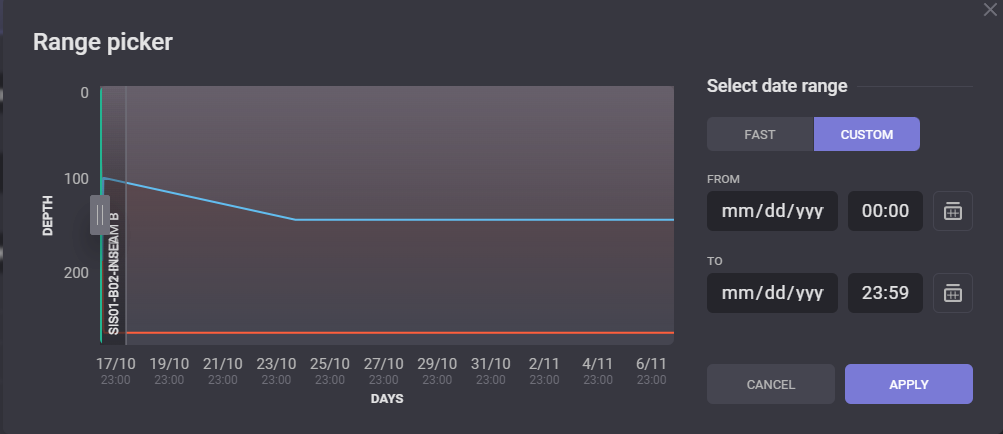
Only dates and time are avilable on the picker that corresponds to selected Well.
Depth mode export
When Depth Mode selected for exporting section for export can be selected from the drop-down list in the Export options. Include parent sections option will take into the range all parent sections. If the selected section is parent itself and there are no sections above it, the range won’t be changed when the Include parent sections is selected.
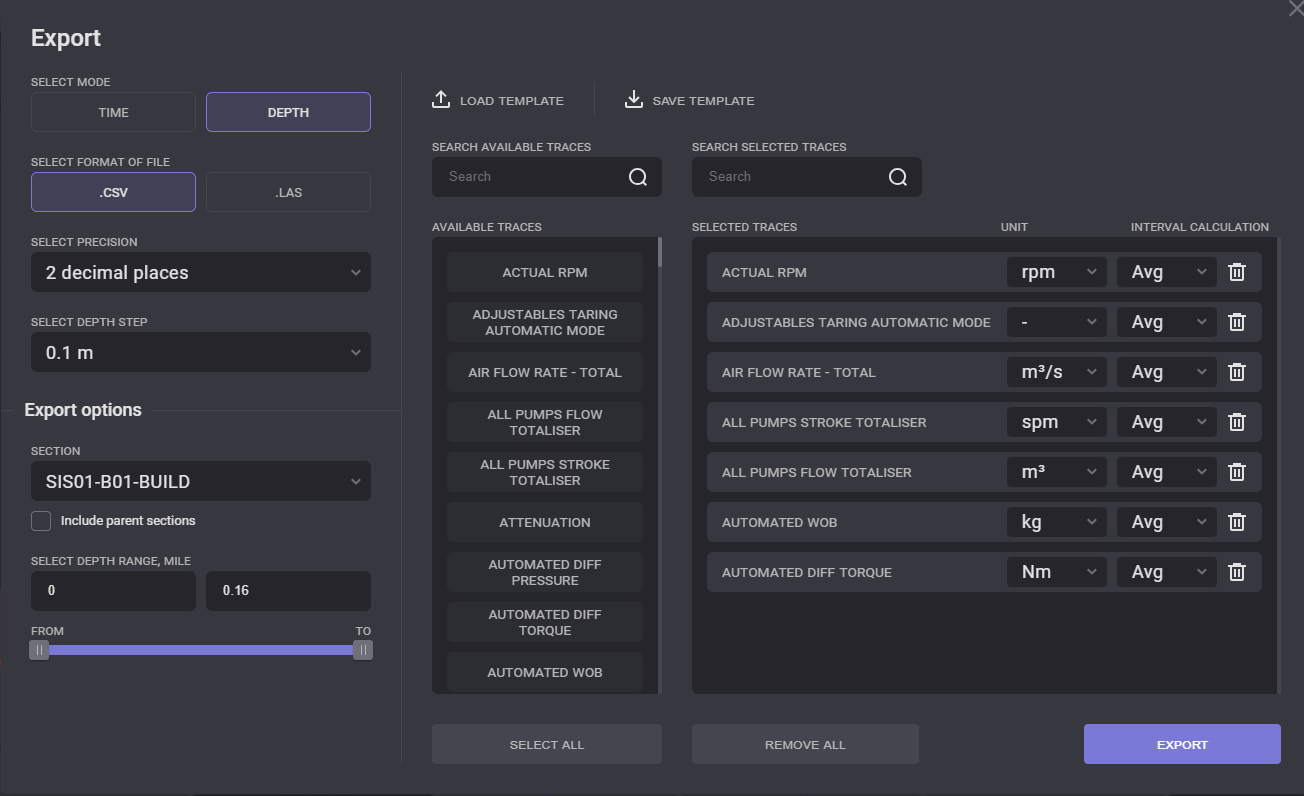
The depth range to be included to the exported file can be defined manually or by dragging FROM and TO controls on the slider.
Adding traces
Traces that will be included to the exported report can be selected by click on it on the available traces list. Picked traces will be displayed in the Selected traces area. All traces will be added for export by clicking on Select All button. Click on Remove All button clears the selected traces list.
The same trace can be added to the report more than once. Units and interval calculation that will be displayed in the report can be specified for the trace. Click on the Units/Interval calculation field expands the drop-down list with available options.
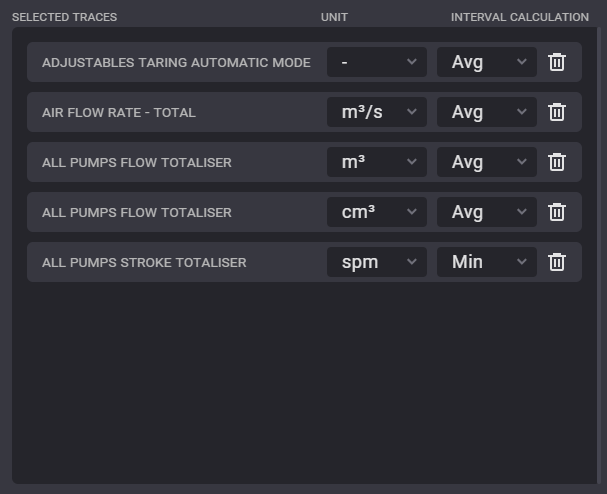
The trace can be removed from the list by clicking on the Delete icon next to it.
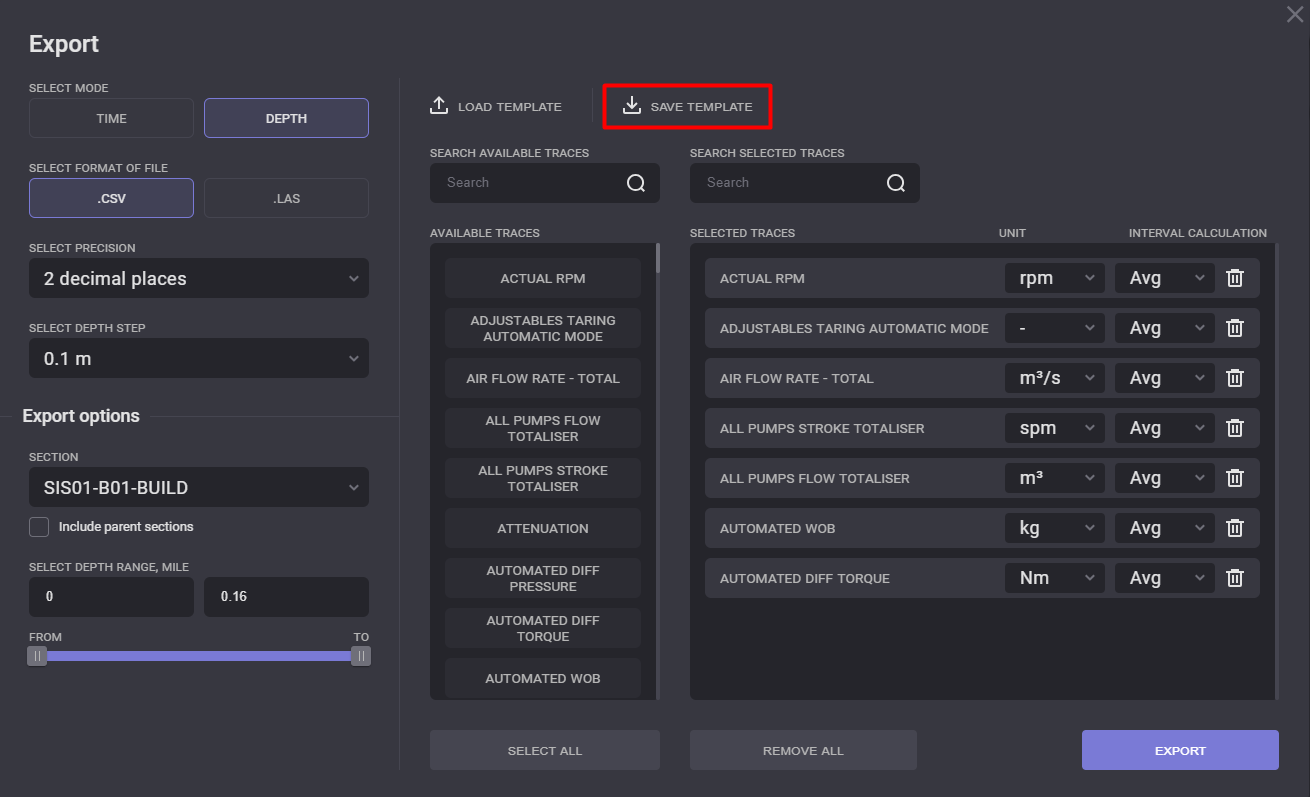
Saving and Loading templates
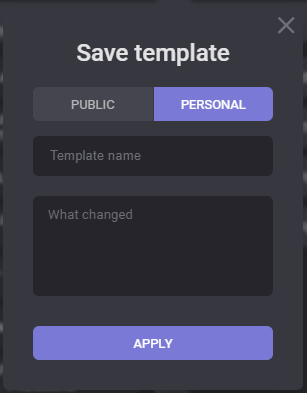
Selected set of parameters can be saved as template and can be used later for fast export. After selecting export parameters, click on the Save template option.
In the opened dialog can be entered Template name and Description. The template can be saved as Public or Personal. The public template will be available for other users of the system.
After saving the template, it can be used for other exports. To apply a set of parameters from the saved template, click on Load template option opens the list of saved templates.
In the opened Load template dialogue list of all available templates will be diasplayed. The list of templates can be sortes by public or personal by clicking on corresponding options in the top right corner.
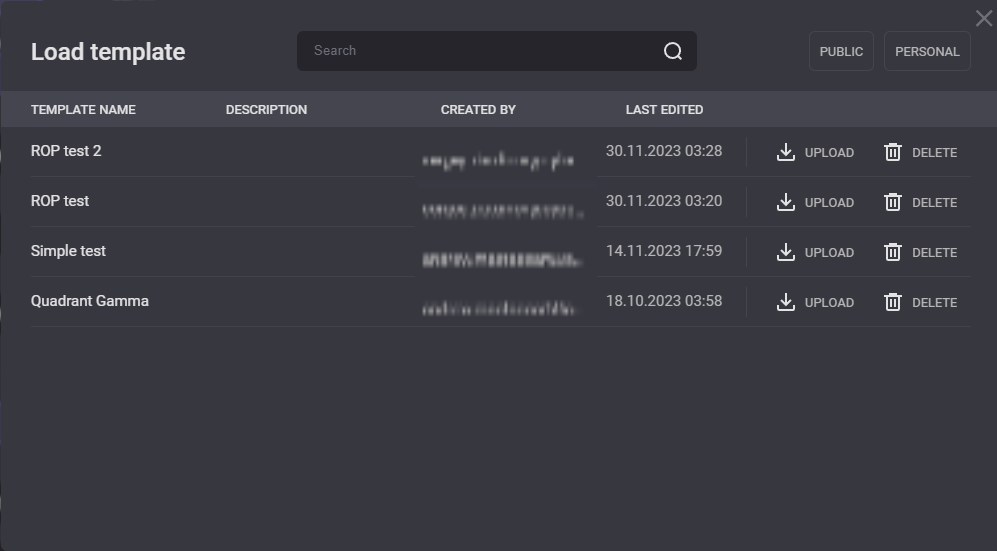
Click on Upload next to the selected template will apply its export parameters. To filter the templates list by its type, use buttons in the top right corner of the dialog.
Please see the following video tutorial about Exporting data on web portal:
Exporting Data Tutorial