
Portal Engineering
Cyberloop delves into the intricacies of torque and drag analysis in drilling operations, providing essential insights to optimize wellbore integrity and drilling performance. This dedicated page offers a wealth of data-driven information, innovative methodologies, and best practices to mitigate challenges and enhance drilling efficiency. From calculating torque and drag forces to understand their impact on drilling dynamics.
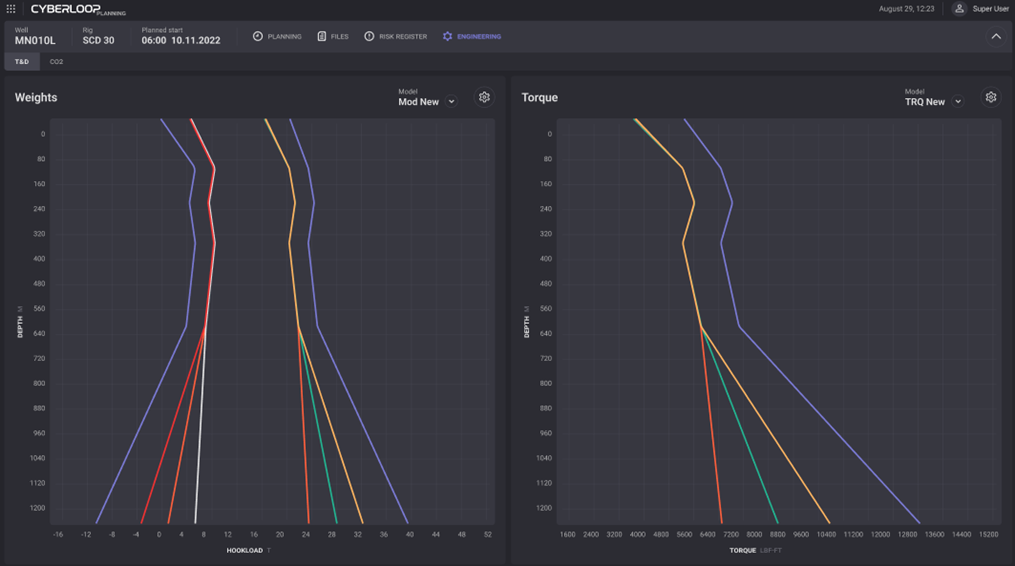
The Torque and Drag charts display the graphics for Weights and Torque.
On the Weight chart the dependencies of the hook load (kg) on depth (m) are plotted. On the Torque chart, the dependencies of torque (Nm) on Depth (m) are plotted.
Plotted parameters and its chart color are defined in the legend on the right side of the chart. Exact values of the specific plotted point can be viewed on hovering on it on the chart.
To change Section click on section field and select necessary section from the drop-down list.
Click on gear button on the top of the graph opens its settings modal window allowing to change the measurement units to display on the graph. In the modal window select necessary units from the drop-down list for one or both axis and click on Apply button. The graph will be re-plotted after closing the modal window.
The model of the charts can be added on the graph. On the top panel of the graph, click on the Select a model field. In the drop-down list Select model… option.