
Portal KPI
Cyberloop provides a comprehensive and data-driven overview of critical metrics that gauge the efficiency, effectiveness, and overall performance of our technical processes and operations. This dedicated KPI dashboard empowers the user to track key benchmarks, identify trends, and make informed decisions to optimize productivity and achieve outstanding results. With real-time updates and intuitive visualizations, our KPI page offers valuable insights to drive continuous improvement and elevate drilling technical endeavours to new heights.
New empty dashboard added by clicking on the Add dashboard button. Name of the Dashboard can be changed by Edit in the option's menu. Dashboard can be removed by clicking on the Delete option in the dashboard options menu.
Cyberloop provides a number of KPI indicators:
· Asset Daily Metrics | · Bit On / Off Bottom |
· Connection Time | · Days vs Depth |
· Rig Activity | · Rig State Per Hour |
· Rig State | · Slide / Rotary |
· Slide vs Rotary | · Tripping Speed |
· Casing Running | · Rate of Advance |
· ROP | · Custom vs Time |
To add a new Key Performance Indicator, please watch the video tutorial below:
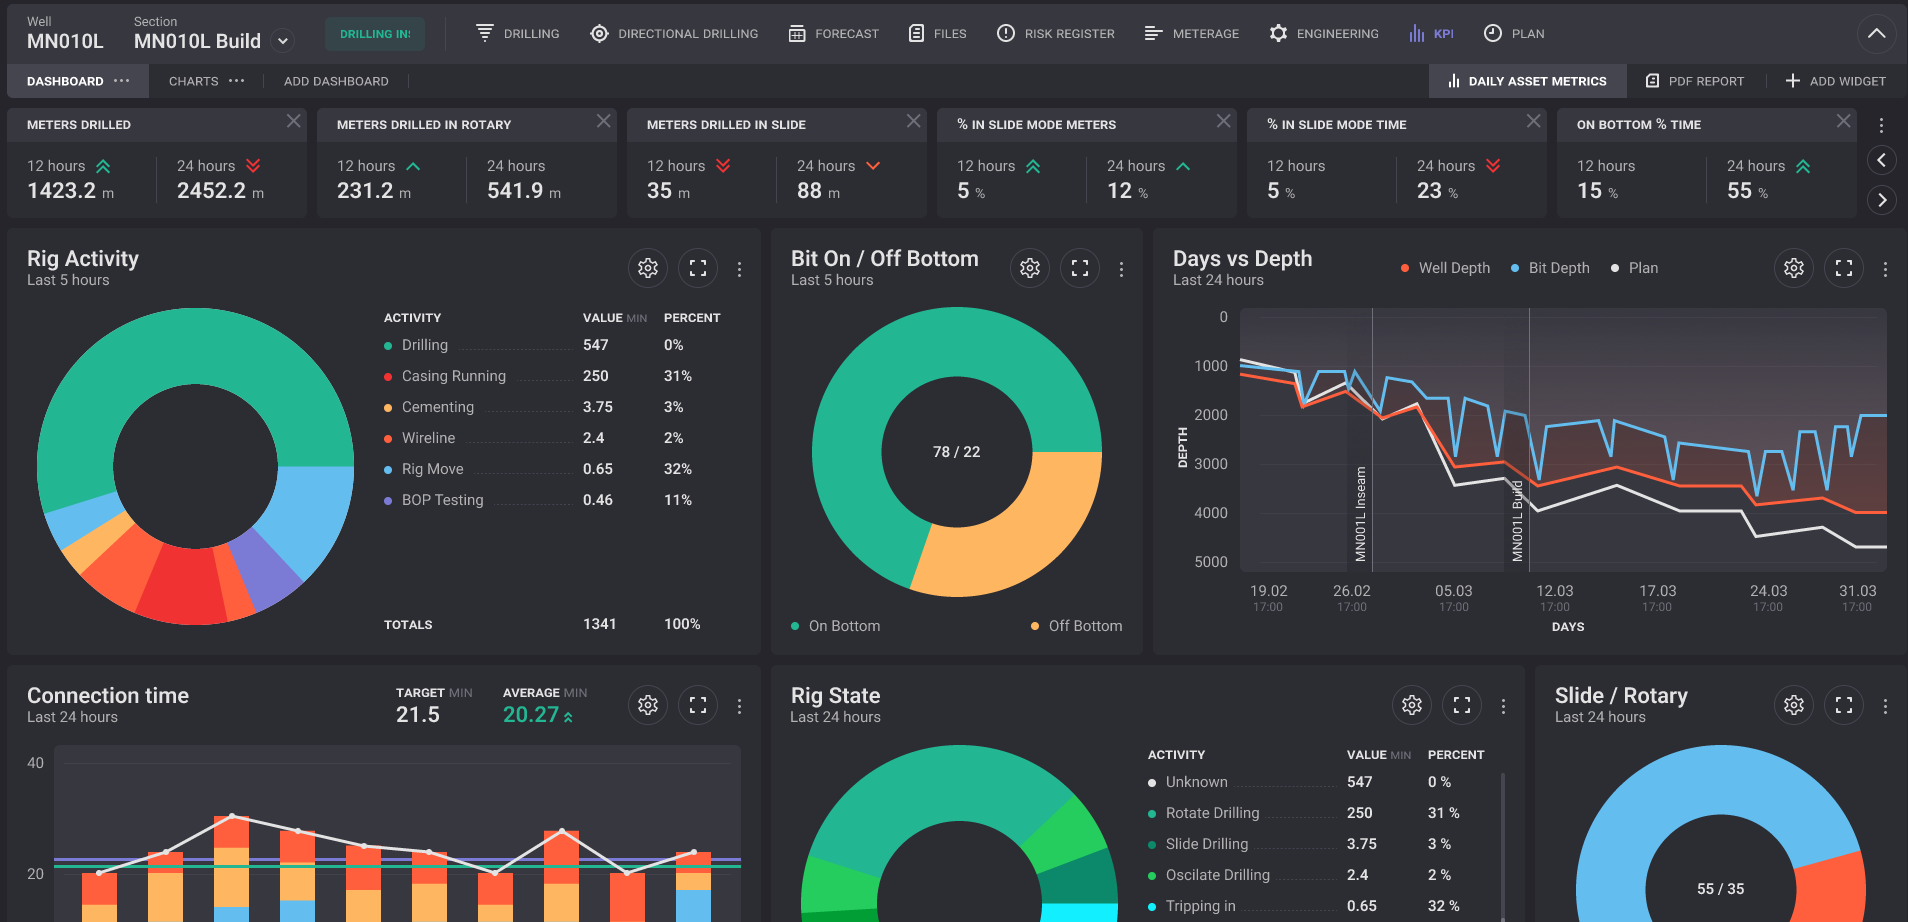
Asset Daily Metrics:
Our Asset Daily Metrics KPI on the web portal provides a concise overview of drilling performance, focusing on key parameters such as meters drilled, meters drilled in rotary mode, meters drilled in slide mode, percentage of time spent in slide mode, percentage of time spent on bottom, and more. These metrics offer real-time insights into drilling efficiency, technique utilization, and operational effectiveness, enabling informed decision-making and proactive adjustments to optimize drilling operations. With clear visualization and up-to-date data, users can track progress, identify trends, and drive continuous improvement efforts for enhanced productivity and performance in drilling activities.
Connection Time
Rig Activity
Rig State
Our Rig State KPI on the web portal offers a comprehensive overview of the operational status of the rig, showcasing the percentage breakdown and duration of various rig activities such as drilling, reaming, pumping, slide drilling, service rig operations, making connections, and more. This KPI provides real-time visibility into the rig's activities, allowing stakeholders to monitor efficiency, identify bottlenecks, and optimize workflow scheduling. With clear graphical representation and detailed time breakdowns, users can analyze rig utilization patterns, track performance trends, and make data-driven decisions to enhance operational effectiveness and maximize productivity across drilling operations.
Slide vs Rotary
Casing Running
ROP
Our Rig State KPI on the web portal provides real-time Rate of Penetration (ROP) values, empowering users to track drilling efficiency dynamically. Users can select a specific depth or time range to plot ROP charts, offering granular insights into drilling performance at different intervals. This feature enables operators to analyze ROP trends, identify optimal drilling conditions, and make informed decisions to enhance productivity and wellbore construction. With interactive visualization tools, stakeholders can effectively monitor drilling operations, optimize drilling parameters, and drive continuous improvement initiatives for increased efficiency and cost-effectiveness.
Bit ON / OFF Bottom
Our Bit ON/OFF Bottom KPI on the web portal tracks the duration of time the drilling bit spends either actively engaged with the formation ("ON Bottom") or disengaged from drilling ("OFF Bottom"). This metric provides valuable insights into drilling efficiency and performance by highlighting periods of productive drilling versus non-drilling activities such as tripping, reaming, or making connections. Users can easily monitor and analyze the distribution of ON/OFF Bottom time intervals, enabling proactive decision-making to optimize drilling operations, minimize downtime, and maximize drilling efficiency. With clear visualization and real-time data updates, stakeholders can effectively manage drilling activities, improve operational planning, and enhance overall rig performance.
Days vs Depth
Rig State per Hour
Our Rig State Per Hour KPI on the web portal provides a detailed hourly breakdown of rig activities, offering insights into the dynamic operational state of the rig over time. Users can view the distribution of rig states, such as drilling, reaming, pumping, slide drilling, service rig operations, making connections, and more, for each hour of operation. This real-time visualization enables stakeholders to monitor drilling efficiency, identify trends, and pinpoint potential areas for optimization or improvement. With hourly updates and interactive features, users can effectively track rig performance, streamline workflow scheduling, and maximize productivity across drilling operations.
Slide / Rotary
Our Slide/Rotary KPI on the web portal offers a detailed breakdown of drilling techniques by displaying the duration of time spent in slide and rotary modes. This metric provides users with insights into the efficiency and distribution of drilling methods over a specific period. By visualizing the proportion of time allocated to sliding versus rotary drilling, stakeholders can assess drilling performance, optimize operational strategies, and improve overall productivity. With clear graphical representation and real-time updates, users can make informed decisions to enhance drilling operations and achieve optimal results.
Rate of Advance
Our Rate of Advance KPI on the web portal provides real-time insights into drilling progress by measuring the depth advancement of the drilling bit. This metric offers a clear indication of drilling efficiency and performance, allowing users to track the rate at which the bit penetrates the subsurface formations. By visualizing the depth achieved over time, stakeholders can assess drilling effectiveness, identify trends, and make informed decisions to optimize drilling parameters and maximize productivity. With intuitive graphical representation and up-to-date data, users can monitor drilling operations closely and drive continuous improvement initiatives for enhanced performance and operational efficiency.
Custom vs Time
Our Custom vs Time KPI feature on the web portal enables users to compare up to three custom-defined tags over time. This dynamic tool empowers users to select specific parameters, attributes, or metrics and visualize their evolution over a defined time period. By leveraging this KPI, stakeholders can gain valuable insights into trends, correlations, and variations in data, facilitating informed decision-making and strategic planning. With the flexibility to tailor comparisons based on user-defined tags, this feature enhances analytical capabilities, fosters deeper understanding of operational performance, and supports data-driven optimization efforts across diverse aspects of the business.