Drilling_v2.
The Drilling tab of the Cyberloop EDR application allows users to monitor drilling processes. The main part of the Drilling tab contains charts and drilling parameters such as Rig Activity, Bit Depth, Hole Depth traces by default. The traces of other charts are adjusted by the user.
On the right panel are placed zoom in, zoom out, scrolling, and mode buttons. The drilling parameters can be monitored in Depth mode or Time mode. If the Depth mode is selected the charts are plotted depending on the hole depth. If the Time mode is selected the charts are plotted depending on the time.
To switch to one of the two modes click on the corresponding button on the right panel. When the monitoring mode is switched on selected the button is highlighted with green color.
The representation of the charts gets updated in real-time if the Live mode is turned on. To turn it on click on the Live button so it is highlighted with green color.
To add parameters to track on the charts click on the Add trace button at the bottom of the chart area. On one chart can be added three parameters.
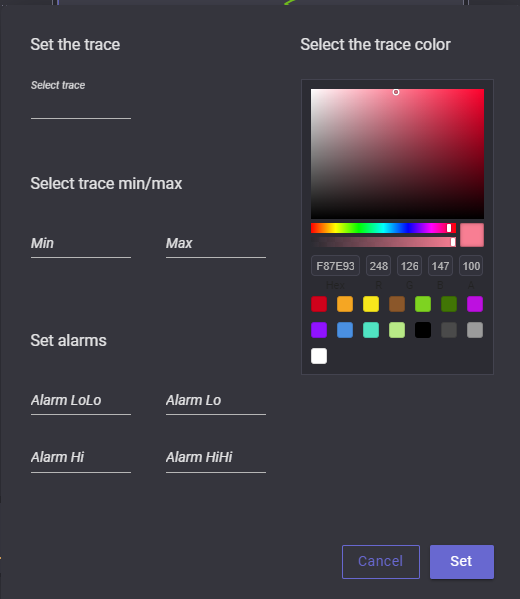
In the opened modal window click on the Select trace field to select parameter to trace on the chart. The range of the parameter can be adjusted by specifying minimum and maximum values for the trace. The graphic for the parameter will be aligned according to entered values. The color of the plotted graphic can be picked in the Select the trace color block. The desired color can be specified on the color pickers or by entering the color number.
In the Set alarms block the values to trigger alarms can be set. There are four values that can be specified:
Alarm LoLo - if the parameter is lower than this value its legend will be highlighted with red color on the chart;
Alarm Lo - if the parameter is lower than this value its legend will be highlighted with yellow color on the chart;
Alarm HiHi - if the parameter is higher than this value its legend will be highlighted with red color on the chart;
Alarm Hi - if the parameter is higher than this value its legend will be highlighted with yellow color on the chart.
To see parameter value at the specific moment or a certain depth hover the mouse on the graphic and a pop-up window with corresponding values will appear.
The parameter can be deleted from the chart by clicking on the X-button of the corresponding parameters' key.
Creating, editing, deleting the workspace
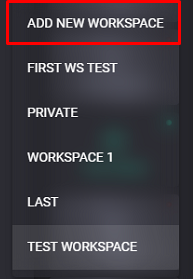
To create a new workspace select the Mode that will be used to track the drilling process. Then click on the button with the current workspace name and select Add New Workspace option.
By default new workspace got created with a default chart showing Rig activity, Bit depth, Hole depth, and one chart that can be adjusted by the user. To change the number of charts for the selected workspace click on the charts button and select from the drop-down list the necessary number of charts. Also, the number of charts and the name of the workspace can be specified on the Settings tab in the Charts section. The workspace can be deleted on the settings tab.
Display Notes
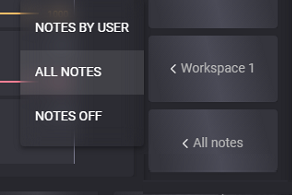
On the Rig activity chart can be displayed user and all notes. Clicking on the displaying notes button expands the list of options:
Notes by user - display on the chart note added by current user;
All notes - display on the chart user notes and quick notes generated automatically or manually;
Notes off - stop displaying any notes on the chat.